NDBC has recently revised the NDBC Handbook of Automated Data Quality Control Checks and Procedures. The new document can be found on our Publications page.

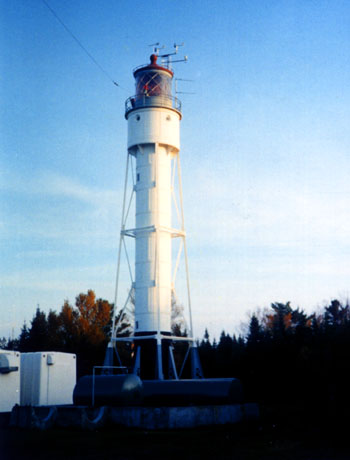
Station DISW3 - Devils Island, WI Image indicating link to RSS feed of recent meteorological observations for station DISW3


Conditions at DISW3 as of
(7:00 pm CDT on 05/16/2025)
0000 GMT on 05/17/2025:
     

Click on the graph icon in the table below to see a time series plot of the last five days of that observation.

5-day plot - Wind Direction Wind Direction (WDIR): E ( 90 deg true )
5-day plot - Wind Speed Wind Speed (WSPD): 7 kts
5-day plot - Wind Gust Wind Gust (GST): 8 kts
5-day plot - Atmospheric Pressure Atmospheric Pressure (PRES):29.30 in
5-day plot - Pressure Tendency Pressure Tendency (PTDY):+0.01 in ( Rising )
5-day plot - Air Temperature Air Temperature (ATMP): 46.2 °F
5-day plot - Dew Point Dew Point (DEWP): 43.5 °F
5-day plot - Wind Chill Wind Chill (CHILL): 42.1 °F
5-day plot - Wind Speed at 10 Meters Wind Speed at 10 meters (WSPD10M): 8 kts
5-day plot - Wind Speed at 20 Meters Wind Speed at 20 meters (WSPD20M): 8 kts
5-day plot -  Wind Speed, Wind Gust and Atmospheric Pressure Combined plot of Wind Speed, Gust, and Air Pressure
Continuous Winds
TIME
(CDT)
5-day plot - Wind Direction WDIR 5-day plot - Wind Speed WSPD
7:00 pmE ( 92 deg ) 6 kts
6:50 pmESE ( 109 deg ) 5 kts
6:40 pmESE ( 108 deg ) 3 kts
6:30 pmE ( 94 deg ) 3 kts
6:20 pmE ( 80 deg ) 3 kts
6:10 pmESE ( 112 deg ) 3 kts
     
Peak gust during the measurement hour
TIME
(CDT)
5-day plot - Gust Direction GDR 5-day plot - Gust Speed GST
6:54 pmE ( 90 deg ) 8 kts
Previous observations
TIME
(CDT)
5-day plot - Wind Direction
WDIR
 
5-day plot - Wind Speed
WSPD
kts
5-day plot - Wind Gust
GST
kts
5-day plot - Wave Height
WVHT
ft
5-day plot - Dominant Wave Period
DPD
sec
5-day plot - Average Wave Period
APD
sec
5-day plot - Mean Wave Direction
MWD
 
5-day plot - Atmospheric Pressure
PRES
in
5-day plot - Pressure Tendency
PTDY
in
5-day plot - Air Temperature
ATMP
°F
5-day plot - Water Temperature
WTMP
°F
5-day plot - Dew Point
DEWP
°F
5-day plot - Salinity
SAL
psu
5-day plot - Visibility
VIS
nmi
5-day plot - Tide (above MLLW)
TIDE
ft
2025-05-16 06:00 pmESE 4 4----29.29+0.01 47.1- 43.5---
2025-05-16 05:00 pm W 2 4----29.28+0.01 48.4- 43.7---
2025-05-16 04:00 pmNNW 5 7----29.28+0.01 47.1- 43.5---
2025-05-16 03:00 pm NW 7 10----29.28+0.04 46.2- 42.8---
2025-05-16 02:00 pm NW 10 11----29.27+0.05 46.9- 43.7---
2025-05-16 01:00 pmNNW 9 10----29.27+0.04 44.6- 42.3---
2025-05-16 12:00 pm NW 15 15----29.24+0.00 46.4- 41.5---
2025-05-16 11:00 amSSW 10 14----29.22-0.04 57.0- 41.4---
2025-05-16 10:00 am S 7 12----29.22-0.06 60.4- 43.3---
2025-05-16 09:00 am S 7 11----29.25-0.03 60.4- 44.1---
2025-05-16 08:00 am S 12 17----29.26-0.04 58.1- 44.8---
2025-05-16 07:00 am SE 6 8----29.28-0.04 53.8- 45.3---
2025-05-16 06:00 am SE 14 19----29.28-0.05 51.3- 44.6---
2025-05-16 05:00 am SE 12 15----29.30-0.06 51.8- 45.3---
2025-05-16 04:00 amSSE 11 14----29.32-0.05 55.0- 46.9---
2025-05-16 03:00 am S 8 14----29.34-0.03 55.9- 46.6---
2025-05-16 02:00 am S 9 11----29.36+0.00 55.9- 48.0---
2025-05-16 01:00 am S 7 10----29.38+0.03 56.7- 50.4---
2025-05-16 12:00 am SW 7 8----29.37+0.04 50.9- 50.2---
2025-05-15 11:00 pm SW 6 7----29.36+0.05 53.2- 51.8---
2025-05-15 10:00 pm S 6 8----29.35+0.00 53.6- 50.5---
2025-05-15 09:00 pmNNE 4 4----29.33+0.02 48.7- 48.2---
2025-05-15 08:00 pm NE 23 24----29.31-0.03 53.2- 53.2---
2025-05-15 07:00 pm E 24 27----29.35-0.04 46.8- 46.8---