


![]() View the latest observations near Atlantic Tropical Storm Bertha and East Pacific Hurricane Fausto.
View the latest observations near Atlantic Tropical Storm Bertha and East Pacific Hurricane Fausto.
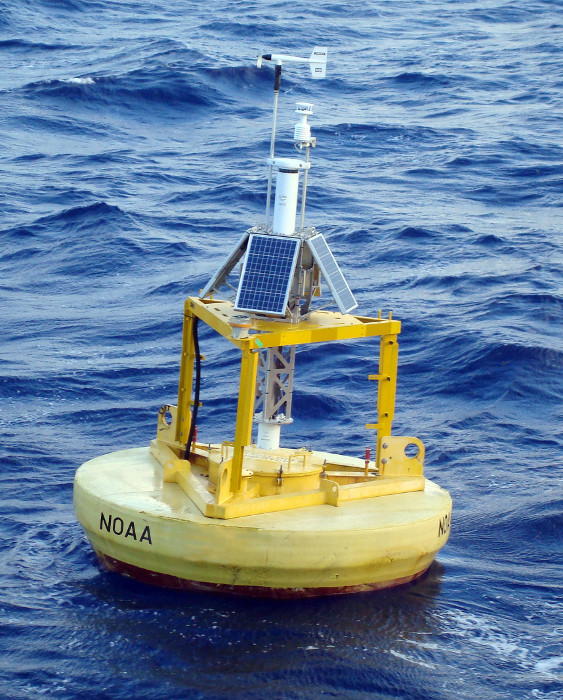
Station 44025 (LLNR 830) - LONG ISLAND - 30 NM South of Islip, NY 
Owned and maintained by National Data Buoy Center
3-meter foam buoy
SCOOP payload
40.258 N 73.175 W (40°15'30" N 73°10'29" W)
Site elevation: sea level
Air temp height: 3.7 m above site elevation
Anemometer height: 4.1 m above site elevation
Barometer elevation: 2.7 m above mean sea level
Sea temp depth: 1.5 m below water line
Water depth: 40.2 m
Watch circle radius: 83 yards
Latest NWS Marine Forecast 1 and Latest NWS Marine Forecast 2
(24 hours for tsunami stations)
|
Click on the graph icon in the table below to see a time series plot of the last five days of that observation. | |
| 3.6 ft | |
| 8 sec | |
| 6.0 sec | |
| S ( 181 deg true ) | |
| TIME (EDT) |
WDIR |
WSPD kts |
GST kts |
WVHT ft |
DPD sec |
APD sec |
MWD |
PRES in |
PTDY in |
ATMP °F |
WTMP °F |
DEWP °F |
SAL psu |
VIS nmi |
TIDE ft |
|---|---|---|---|---|---|---|---|---|---|---|---|---|---|---|---|
| 2026-07-23 01:40 pm | - | - | - | 3.6 | 8 | 5.7 | S | - | - | - | 73.0 | - | - | - | - |
| 2026-07-23 01:10 pm | - | - | - | 3.9 | 8 | 5.6 | S | - | - | - | - | - | - | - | - |
| 2026-07-23 12:40 pm | - | - | - | 4.3 | 8 | 5.9 | S | - | - | - | 73.0 | - | - | - | - |
| 2026-07-23 12:10 pm | - | - | - | 3.6 | 8 | 5.4 | S | - | - | - | 72.9 | - | - | - | - |
| 2026-07-23 11:10 am | - | - | - | 4.3 | 8 | 5.3 | S | - | - | - | 72.7 | - | - | - | - |
| 2026-07-23 10:40 am | - | - | - | 3.9 | 8 | 5.0 | S | - | - | - | 72.5 | - | - | - | - |
| 2026-07-23 10:10 am | - | - | - | 4.3 | 8 | 5.1 | S | - | - | - | 72.3 | - | - | - | - |
| 2026-07-23 09:40 am | - | - | - | 4.6 | 8 | 4.9 | S | - | - | - | 72.3 | - | - | - | - |
| 2026-07-23 09:10 am | - | - | - | 4.6 | 8 | 5.0 | S | - | - | - | 72.3 | - | - | - | - |
| 2026-07-23 08:40 am | - | - | - | 4.3 | 8 | 4.7 | S | - | - | - | 72.1 | - | - | - | - |
| 2026-07-23 08:10 am | - | - | - | 4.6 | 8 | 4.7 | S | - | - | - | 72.1 | - | - | - | - |
| 2026-07-23 07:40 am | - | - | - | 4.3 | 9 | 4.6 | S | - | - | - | 72.1 | - | - | - | - |
| 2026-07-23 07:10 am | - | - | - | 4.6 | 8 | 4.9 | S | - | - | - | 72.1 | - | - | - | - |
| 2026-07-23 06:40 am | - | - | - | 4.6 | 8 | 4.8 | S | - | - | - | 72.1 | - | - | - | - |
| 2026-07-23 06:10 am | - | - | - | 4.6 | 8 | 4.9 | S | - | - | - | 72.1 | - | - | - | - |
| 2026-07-23 05:40 am | - | - | - | 4.6 | 8 | 4.9 | S | - | - | - | 72.1 | - | - | - | - |
| 2026-07-23 05:10 am | - | - | - | 5.2 | 8 | 5.1 | S | - | - | - | 72.3 | - | - | - | - |
| 2026-07-23 04:40 am | - | - | - | 4.9 | 9 | 4.7 | S | - | - | - | 72.3 | - | - | - | - |
| 2026-07-23 04:10 am | - | - | - | 4.9 | 9 | 4.8 | S | - | - | - | 72.5 | - | - | - | - |
| 2026-07-23 03:40 am | - | - | - | 4.9 | 8 | 4.7 | S | - | - | - | 72.5 | - | - | - | - |
| 2026-07-23 03:10 am | - | - | - | 5.2 | 8 | 4.9 | S | - | - | - | 72.5 | - | - | - | - |
| 2026-07-23 02:40 am | - | - | - | 5.2 | 9 | 5.2 | S | - | - | - | 72.7 | - | - | - | - |
| 2026-07-23 02:10 am | - | - | - | 5.2 | 8 | 5.3 | S | - | - | - | 73.0 | - | - | - | - |
| 2026-07-23 01:40 am | - | - | - | 5.6 | 8 | 5.7 | S | - | - | - | 73.2 | - | - | - | - |
| 2026-07-23 12:40 am | - | - | - | 5.9 | 8 | 5.9 | S | - | - | - | 72.9 | - | - | - | - |
| 2026-07-23 12:10 am | - | - | - | 5.6 | 8 | 6.1 | S | - | - | - | 72.9 | - | - | - | - |
| 2026-07-22 11:40 pm | - | - | - | 5.6 | 9 | 5.9 | S | - | - | - | 72.7 | - | - | - | - |
| 2026-07-22 11:10 pm | - | - | - | 6.2 | 9 | 6.1 | S | - | - | - | 72.9 | - | - | - | - |
| 2026-07-22 10:40 pm | - | - | - | 5.9 | 8 | 5.9 | S | - | - | - | 72.7 | - | - | - | - |
| 2026-07-22 09:40 pm | - | - | - | 6.2 | 8 | 5.9 | S | - | - | - | 72.9 | - | - | - | - |
| 2026-07-22 09:10 pm | - | - | - | 6.6 | 9 | 6.3 | S | - | - | - | 73.0 | - | - | - | - |
| 2026-07-22 08:40 pm | - | - | - | 6.2 | 9 | 6.0 | S | - | - | - | 73.2 | - | - | - | - |
| 2026-07-22 08:10 pm | - | - | - | 6.2 | 9 | 6.1 | S | - | - | - | 73.2 | - | - | - | - |
| 2026-07-22 07:10 pm | - | - | - | 7.2 | 8 | 6.2 | S | - | - | - | - | - | - | - | - |
| 2026-07-22 06:40 pm | - | - | - | 6.6 | 8 | 6.1 | S | - | - | - | 73.8 | - | - | - | - |
| 2026-07-22 06:10 pm | - | - | - | 6.6 | 9 | 6.2 | S | - | - | - | 73.8 | - | - | - | - |
| 2026-07-22 05:40 pm | - | - | - | 7.2 | 9 | 6.2 | S | - | - | - | 73.8 | - | - | - | - |
| 2026-07-22 05:10 pm | - | - | - | 6.9 | 9 | 6.2 | S | - | - | - | 73.8 | - | - | - | - |
| 2026-07-22 04:40 pm | - | - | - | 7.2 | 9 | 6.4 | S | - | - | - | 73.6 | - | - | - | - |
| 2026-07-22 04:10 pm | - | - | - | 6.9 | 8 | 6.2 | S | - | - | - | 72.3 | - | - | - | - |
|
These wave data are displayed in rounded times. Click on the graph icon in the table below to see a time series plot of the last five days of that observation. | |
| 3.6 ft | |
| AVERAGE | |
| 6.0 sec | |
| TIME (EDT) |
WVHT ft |
SwH ft |
SwP sec |
SwD |
WWH ft |
WWP sec |
WWD |
STEEPNESS |
APD sec |
|---|---|---|---|---|---|---|---|---|---|
| 2026-07-23 01:40 pm | 3.6 | - | - | - | - | - | - | AVERAGE | 5.7 |
| 2026-07-23 01:10 pm | 3.9 | - | - | - | - | - | - | AVERAGE | 5.6 |
| 2026-07-23 12:40 pm | 4.3 | - | - | - | - | - | - | AVERAGE | 5.9 |
| 2026-07-23 12:10 pm | 3.6 | - | - | - | - | - | - | AVERAGE | 5.4 |
| 2026-07-23 11:10 am | 4.3 | - | - | - | - | - | - | AVERAGE | 5.3 |
| 2026-07-23 10:40 am | 3.9 | - | - | - | - | - | - | AVERAGE | 5.0 |
| 2026-07-23 10:10 am | 4.3 | - | - | - | - | - | - | AVERAGE | 5.1 |
| 2026-07-23 09:40 am | 4.6 | - | - | - | - | - | - | AVERAGE | 4.9 |
| 2026-07-23 09:10 am | 4.6 | - | - | - | - | - | - | AVERAGE | 5.0 |
| 2026-07-23 08:40 am | 4.3 | - | - | - | - | - | - | AVERAGE | 4.7 |
| 2026-07-23 08:10 am | 4.6 | - | - | - | - | - | - | AVERAGE | 4.7 |
| 2026-07-23 07:40 am | 4.3 | - | - | - | - | - | - | N/A | 4.6 |
| 2026-07-23 07:10 am | 4.6 | - | - | - | - | - | - | AVERAGE | 4.9 |
| 2026-07-23 06:40 am | 4.6 | - | - | - | - | - | - | AVERAGE | 4.8 |
| 2026-07-23 06:10 am | 4.6 | - | - | - | - | - | - | AVERAGE | 4.9 |
| 2026-07-23 05:40 am | 4.6 | - | - | - | - | - | - | AVERAGE | 4.9 |
| 2026-07-23 05:10 am | 5.2 | - | - | - | - | - | - | AVERAGE | 5.1 |
| 2026-07-23 04:40 am | 4.9 | - | - | - | - | - | - | N/A | 4.7 |
| 2026-07-23 04:10 am | 4.9 | - | - | - | - | - | - | AVERAGE | 4.8 |
| 2026-07-23 03:40 am | 4.9 | - | - | - | - | - | - | AVERAGE | 4.7 |
| 2026-07-23 03:10 am | 5.2 | - | - | - | - | - | - | AVERAGE | 4.9 |
| 2026-07-23 02:40 am | 5.2 | - | - | - | - | - | - | AVERAGE | 5.2 |
| 2026-07-23 02:10 am | 5.2 | - | - | - | - | - | - | AVERAGE | 5.3 |
| 2026-07-23 01:40 am | 5.6 | - | - | - | - | - | - | STEEP | 5.7 |
| 2026-07-23 12:40 am | 5.9 | - | - | - | - | - | - | AVERAGE | 5.9 |
| 2026-07-23 12:10 am | 5.6 | - | - | - | - | - | - | AVERAGE | 6.1 |
| 2026-07-22 11:40 pm | 5.6 | - | - | - | - | - | - | AVERAGE | 5.9 |
| 2026-07-22 11:10 pm | 6.2 | - | - | - | - | - | - | AVERAGE | 6.1 |
| 2026-07-22 10:40 pm | 5.9 | - | - | - | - | - | - | AVERAGE | 5.9 |
| 2026-07-22 09:40 pm | 6.2 | - | - | - | - | - | - | AVERAGE | 5.9 |
| 2026-07-22 09:10 pm | 6.6 | - | - | - | - | - | - | AVERAGE | 6.3 |
| 2026-07-22 08:40 pm | 6.2 | - | - | - | - | - | - | AVERAGE | 6.0 |
| 2026-07-22 08:10 pm | 6.2 | - | - | - | - | - | - | AVERAGE | 6.1 |
| 2026-07-22 07:10 pm | 7.2 | - | - | - | - | - | - | AVERAGE | 6.2 |
| 2026-07-22 06:40 pm | 6.6 | - | - | - | - | - | - | AVERAGE | 6.1 |
| 2026-07-22 06:10 pm | 6.6 | - | - | - | - | - | - | AVERAGE | 6.2 |
| 2026-07-22 05:40 pm | 7.2 | - | - | - | - | - | - | AVERAGE | 6.2 |
| 2026-07-22 05:10 pm | 6.9 | - | - | - | - | - | - | AVERAGE | 6.2 |
| 2026-07-22 04:40 pm | 7.2 | - | - | - | - | - | - | AVERAGE | 6.4 |
| 2026-07-22 04:10 pm | 6.9 | - | - | - | - | - | - | AVERAGE | 6.2 |
Links which are specific to this station are listed below:
Real Time Data in tabular form for the last forty-five days.
Historical Data & Climatic Summaries for quality controlled data for prior months and years.
The weekly status report and the weekly maintenance report also provide valuable station information.
Note that the payload types and the station locations occasionally change.