


![]() View the latest observations near East Pacific Tropical Storm Elida.
View the latest observations near East Pacific Tropical Storm Elida.
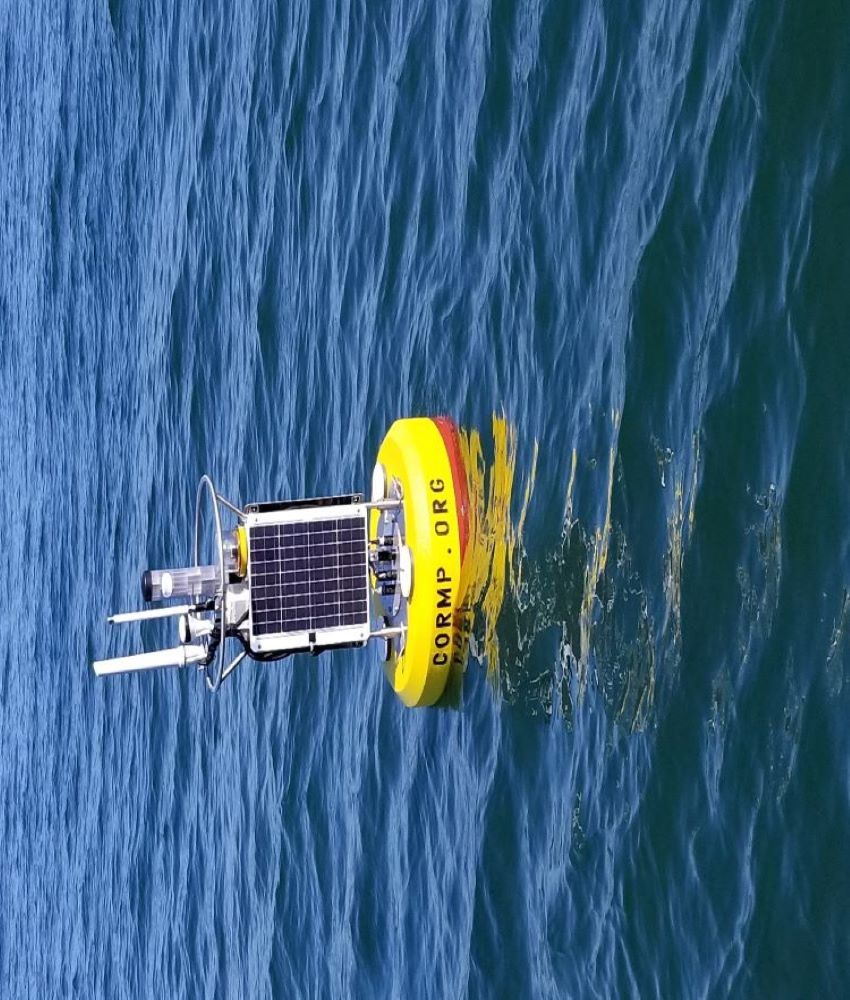
Station SSBN7 - Sunset Beach Nearshore Waves (SUN2WAVE) 
Owned and maintained by Coastal Ocean Research and Monitoring Program (CORMP)
Moored Buoy
33.838 N 78.484 W (33°50'19" N 78°29'3" W)
Site elevation: sea level
Water depth: 9.75 m
Right whales are active off NC from November to April. Speed restrictions of 10 knots apply to vessels 65 feet or greater within the vicinity of this station between November 1 and April 30.? To learn more about right whales and rules protecting them, go to: http://www.nmfs.noaa.gov/pr/shipstrike.
Meteorological data from this buoy (41024) can be viewed here.
Meteorological data from this buoy (41024) can be viewed here.
Large icon indicates selected station.
 Stations with recent data
 Stations with no data in last 8 hours
(24 hours for tsunami stations)
(24 hours for tsunami stations)
|
Click on the graph icon in the table below to see a time series plot of the last five days of that observation. | |
| 1.6 ft | |
| 9 sec | |
| 4.0 sec | |
| ESE ( 119 deg true ) | |
| 84.4 °F | |
| TIME (EDT) |
WDIR |
WSPD kts |
GST kts |
WVHT ft |
DPD sec |
APD sec |
MWD |
PRES in |
PTDY in |
ATMP °F |
WTMP °F |
DEWP °F |
SAL psu |
VIS nmi |
TIDE ft |
|---|---|---|---|---|---|---|---|---|---|---|---|---|---|---|---|
| 2026-07-15 09:25 am | - | - | - | - | - | - | - | - | - | - | 84.4 | - | - | - | - |
| 2026-07-15 09:20 am | - | - | - | 1.6 | - | 3.9 | ESE | - | - | - | 84.4 | - | - | - | - |
| 2026-07-15 09:15 am | - | - | - | 1.6 | - | 3.8 | ESE | - | - | - | 84.4 | - | - | - | - |
| 2026-07-15 09:10 am | - | - | - | - | - | - | - | - | - | - | 84.2 | - | - | - | - |
| 2026-07-15 09:05 am | - | - | - | 1.6 | 9 | 3.9 | ESE | - | - | - | 84.2 | - | - | - | - |
| 2026-07-15 09:00 am | - | - | - | 1.6 | 9 | 3.8 | ESE | - | - | - | 84.2 | - | - | - | - |
| 2026-07-15 08:55 am | - | - | - | 1.6 | - | 3.9 | ESE | - | - | - | 84.2 | - | - | - | - |
| 2026-07-15 08:50 am | - | - | - | 1.6 | - | 3.8 | ESE | - | - | - | 84.2 | - | - | - | - |
| 2026-07-15 08:45 am | - | - | - | 2.0 | - | 4.1 | ESE | - | - | - | 84.2 | - | - | - | - |
| 2026-07-15 08:40 am | - | - | - | - | - | - | - | - | - | - | 84.2 | - | - | - | - |
| 2026-07-15 08:35 am | - | - | - | - | - | - | - | - | - | - | 84.2 | - | - | - | - |
| 2026-07-15 08:30 am | - | - | - | 2.0 | 9 | 4.1 | ESE | - | - | - | 84.2 | - | - | - | - |
| 2026-07-15 08:25 am | - | - | - | - | - | - | - | - | - | - | 84.2 | - | - | - | - |
| 2026-07-15 08:20 am | - | - | - | 2.0 | - | 3.8 | SE | - | - | - | 84.2 | - | - | - | - |
| 2026-07-15 08:15 am | - | - | - | 1.6 | - | 3.8 | ESE | - | - | - | 84.2 | - | - | - | - |
| 2026-07-15 08:10 am | - | - | - | - | - | - | - | - | - | - | 84.2 | - | - | - | - |
| 2026-07-15 08:05 am | - | - | - | 2.0 | 9 | 3.8 | SE | - | - | - | 84.2 | - | - | - | - |
| 2026-07-15 08:00 am | - | - | - | 1.6 | 9 | 3.8 | ESE | - | - | - | 84.2 | - | - | - | - |
| 2026-07-15 07:55 am | - | - | - | 2.0 | - | 3.8 | SE | - | - | - | 84.2 | - | - | - | - |
| 2026-07-15 07:50 am | - | - | - | 1.6 | - | 3.8 | ESE | - | - | - | 84.2 | - | - | - | - |
| 2026-07-15 07:45 am | - | - | - | 2.0 | - | 3.8 | ESE | - | - | - | 84.2 | - | - | - | - |
| 2026-07-15 07:40 am | - | - | - | - | - | - | - | - | - | - | 84.2 | - | - | - | - |
| 2026-07-15 07:35 am | - | - | - | - | - | - | - | - | - | - | 84.2 | - | - | - | - |
| 2026-07-15 07:30 am | - | - | - | 2.0 | 9 | 3.8 | ESE | - | - | - | 84.2 | - | - | - | - |
| 2026-07-15 07:25 am | - | - | - | - | - | - | - | - | - | - | 84.2 | - | - | - | - |
| 2026-07-15 07:20 am | - | - | - | 2.0 | - | 3.7 | SE | - | - | - | 84.2 | - | - | - | - |
| 2026-07-15 07:15 am | - | - | - | 1.6 | - | 3.7 | ESE | - | - | - | 84.2 | - | - | - | - |
| 2026-07-15 07:10 am | - | - | - | - | - | - | - | - | - | - | 84.2 | - | - | - | - |
| 2026-07-15 07:05 am | - | - | - | 2.0 | 9 | 3.7 | SE | - | - | - | 84.2 | - | - | - | - |
| 2026-07-15 07:00 am | - | - | - | 1.6 | 9 | 3.7 | ESE | - | - | - | 84.2 | - | - | - | - |
| 2026-07-15 06:55 am | - | - | - | 2.0 | - | 3.7 | SE | - | - | - | 84.2 | - | - | - | - |
| 2026-07-15 06:50 am | - | - | - | 1.6 | - | 3.7 | ESE | - | - | - | 84.2 | - | - | - | - |
| 2026-07-15 06:45 am | - | - | - | 1.6 | - | 3.6 | ESE | - | - | - | 84.2 | - | - | - | - |
| 2026-07-15 06:40 am | - | - | - | - | - | - | - | - | - | - | 84.2 | - | - | - | - |
| 2026-07-15 06:35 am | - | - | - | - | - | - | - | - | - | - | 84.2 | - | - | - | - |
| 2026-07-15 06:30 am | - | - | - | 1.6 | 9 | 3.6 | ESE | - | - | - | 84.2 | - | - | - | - |
| 2026-07-15 06:25 am | - | - | - | - | - | - | - | - | - | - | 84.2 | - | - | - | - |
| 2026-07-15 06:20 am | - | - | - | 1.6 | - | 3.8 | SE | - | - | - | 84.2 | - | - | - | - |
| 2026-07-15 06:15 am | - | - | - | 1.6 | - | 3.7 | SE | - | - | - | 84.2 | - | - | - | - |
| 2026-07-15 06:10 am | - | - | - | - | - | - | - | - | - | - | 84.2 | - | - | - | - |
| 2026-07-15 06:05 am | - | - | - | 1.6 | 9 | 3.8 | SE | - | - | - | 84.2 | - | - | - | - |
| 2026-07-15 06:00 am | - | - | - | 1.6 | 9 | 3.7 | SE | - | - | - | 84.2 | - | - | - | - |
| 2026-07-15 05:55 am | - | - | - | 1.6 | - | 3.8 | SE | - | - | - | 84.2 | - | - | - | - |
| 2026-07-15 05:50 am | - | - | - | 1.6 | - | 3.7 | SE | - | - | - | 84.2 | - | - | - | - |
| 2026-07-15 05:45 am | - | - | - | 1.6 | - | 3.9 | SE | - | - | - | 84.2 | - | - | - | - |
| 2026-07-15 05:40 am | - | - | - | - | - | - | - | - | - | - | 84.2 | - | - | - | - |
| 2026-07-15 05:35 am | - | - | - | - | - | - | - | - | - | - | 84.2 | - | - | - | - |
| 2026-07-15 05:30 am | - | - | - | 1.6 | 9 | 3.9 | SE | - | - | - | 84.2 | - | - | - | - |
| 2026-07-15 05:25 am | - | - | - | - | - | - | - | - | - | - | 84.2 | - | - | - | - |
| 2026-07-15 05:20 am | - | - | - | 1.6 | - | 3.9 | SE | - | - | - | 84.2 | - | - | - | - |
| 2026-07-15 05:15 am | - | - | - | 1.6 | - | 4.1 | SE | - | - | - | 84.2 | - | - | - | - |
| 2026-07-15 05:10 am | - | - | - | - | - | - | - | - | - | - | 84.2 | - | - | - | - |
| 2026-07-15 05:05 am | - | - | - | 1.6 | 9 | 3.9 | SE | - | - | - | 84.2 | - | - | - | - |
| 2026-07-15 05:00 am | - | - | - | 1.6 | 8 | 4.1 | SE | - | - | - | 84.2 | - | - | - | - |
| 2026-07-15 04:55 am | - | - | - | 1.6 | - | 3.9 | SE | - | - | - | 84.2 | - | - | - | - |
| 2026-07-15 04:50 am | - | - | - | 1.6 | - | 4.1 | SE | - | - | - | 84.2 | - | - | - | - |
| 2026-07-15 04:45 am | - | - | - | 1.6 | - | 3.8 | SE | - | - | - | 84.2 | - | - | - | - |
| 2026-07-15 04:40 am | - | - | - | - | - | - | - | - | - | - | 84.2 | - | - | - | - |
| 2026-07-15 04:35 am | - | - | - | - | - | - | - | - | - | - | 84.2 | - | - | - | - |
| 2026-07-15 04:30 am | - | - | - | 1.6 | 9 | 3.8 | SE | - | - | - | 84.2 | - | - | - | - |
| 2026-07-15 04:25 am | - | - | - | - | - | - | - | - | - | - | 84.2 | - | - | - | - |
| 2026-07-15 04:20 am | - | - | - | 2.0 | - | 3.9 | SE | - | - | - | 84.4 | - | - | - | - |
| 2026-07-15 04:15 am | - | - | - | 2.0 | - | 4.1 | SE | - | - | - | 84.4 | - | - | - | - |
| 2026-07-15 04:10 am | - | - | - | - | - | - | - | - | - | - | 84.4 | - | - | - | - |
| 2026-07-15 04:05 am | - | - | - | 2.0 | 9 | 3.9 | SE | - | - | - | 84.4 | - | - | - | - |
| 2026-07-15 04:00 am | - | - | - | 2.0 | 9 | 4.1 | SE | - | - | - | 84.4 | - | - | - | - |
| 2026-07-15 03:55 am | - | - | - | - | - | - | - | - | - | - | 84.4 | - | - | - | - |
| 2026-07-15 03:50 am | - | - | - | - | - | - | - | - | - | - | 84.4 | - | - | - | - |
| 2026-07-15 03:45 am | - | - | - | 1.6 | - | 3.7 | ESE | - | - | - | 84.4 | - | - | - | - |
| 2026-07-15 03:40 am | - | - | - | - | - | - | - | - | - | - | 84.4 | - | - | - | - |
| 2026-07-15 03:35 am | - | - | - | - | - | - | - | - | - | - | 84.4 | - | - | - | - |
| 2026-07-15 03:30 am | - | - | - | 1.6 | 9 | 3.7 | ESE | - | - | - | 84.4 | - | - | - | - |
| 2026-07-15 03:25 am | - | - | - | - | - | - | - | - | - | - | 84.4 | - | - | - | - |
| 2026-07-15 03:20 am | - | - | - | 2.0 | - | 4.0 | SE | - | - | - | 84.4 | - | - | - | - |
| 2026-07-15 03:15 am | - | - | - | 2.0 | - | 4.1 | ESE | - | - | - | 84.4 | - | - | - | - |
| 2026-07-15 03:10 am | - | - | - | - | - | - | - | - | - | - | 84.4 | - | - | - | - |
| 2026-07-15 03:05 am | - | - | - | 2.0 | 9 | 4.0 | SE | - | - | - | 84.4 | - | - | - | - |
| 2026-07-15 03:00 am | - | - | - | 2.0 | 9 | 4.1 | ESE | - | - | - | 84.4 | - | - | - | - |
| 2026-07-15 02:55 am | - | - | - | 2.0 | - | 4.0 | SE | - | - | - | 84.4 | - | - | - | - |
| 2026-07-15 02:50 am | - | - | - | 2.0 | - | 4.1 | ESE | - | - | - | 84.4 | - | - | - | - |
| 2026-07-15 02:45 am | - | - | - | 2.0 | - | 4.0 | ESE | - | - | - | 84.4 | - | - | - | - |
| 2026-07-15 02:40 am | - | - | - | - | - | - | - | - | - | - | 84.4 | - | - | - | - |
| 2026-07-15 02:35 am | - | - | - | - | - | - | - | - | - | - | 84.4 | - | - | - | - |
| 2026-07-15 02:30 am | - | - | - | 2.0 | 9 | 4.0 | ESE | - | - | - | 84.4 | - | - | - | - |
| 2026-07-15 02:25 am | - | - | - | - | - | - | - | - | - | - | 84.4 | - | - | - | - |
| 2026-07-15 02:20 am | - | - | - | 2.3 | - | 4.0 | SE | - | - | - | 84.4 | - | - | - | - |
| 2026-07-15 02:15 am | - | - | - | 2.0 | - | 4.0 | ESE | - | - | - | 84.4 | - | - | - | - |
| 2026-07-15 02:10 am | - | - | - | - | - | - | - | - | - | - | 84.4 | - | - | - | - |
| 2026-07-15 02:05 am | - | - | - | 2.3 | 9 | 4.0 | SE | - | - | - | 84.4 | - | - | - | - |
| 2026-07-15 02:00 am | - | - | - | 2.0 | 9 | 4.0 | ESE | - | - | - | 84.4 | - | - | - | - |
| 2026-07-15 01:55 am | - | - | - | 2.3 | - | 4.0 | SE | - | - | - | 84.4 | - | - | - | - |
| 2026-07-15 01:50 am | - | - | - | 2.0 | - | 4.0 | ESE | - | - | - | 84.4 | - | - | - | - |
| 2026-07-15 01:45 am | - | - | - | 2.0 | - | 4.0 | ESE | - | - | - | 84.4 | - | - | - | - |
| 2026-07-15 01:40 am | - | - | - | - | - | - | - | - | - | - | 84.4 | - | - | - | - |
| 2026-07-15 01:35 am | - | - | - | - | - | - | - | - | - | - | 84.4 | - | - | - | - |
| 2026-07-15 01:30 am | - | - | - | 2.0 | 4 | 4.0 | ESE | - | - | - | 84.4 | - | - | - | - |
| 2026-07-15 01:25 am | - | - | - | - | - | - | - | - | - | - | 84.4 | - | - | - | - |
| 2026-07-15 01:20 am | - | - | - | 2.3 | - | 4.0 | ESE | - | - | - | 84.4 | - | - | - | - |
| 2026-07-15 01:15 am | - | - | - | 2.3 | - | 4.0 | ESE | - | - | - | 84.4 | - | - | - | - |
| 2026-07-15 01:10 am | - | - | - | - | - | - | - | - | - | - | 84.4 | - | - | - | - |
| 2026-07-15 01:05 am | - | - | - | 2.3 | 4 | 4.0 | ESE | - | - | - | 84.4 | - | - | - | - |
| 2026-07-15 01:00 am | - | - | - | 2.3 | 4 | 4.0 | ESE | - | - | - | 84.4 | - | - | - | - |
| 2026-07-15 12:55 am | - | - | - | 2.3 | - | 4.0 | ESE | - | - | - | 84.4 | - | - | - | - |
| 2026-07-15 12:50 am | - | - | - | 2.3 | - | 4.0 | ESE | - | - | - | 84.4 | - | - | - | - |
| 2026-07-15 12:45 am | - | - | - | 2.6 | - | 4.1 | ESE | - | - | - | 84.4 | - | - | - | - |
| 2026-07-15 12:40 am | - | - | - | - | - | - | - | - | - | - | 84.4 | - | - | - | - |
| 2026-07-15 12:35 am | - | - | - | - | - | - | - | - | - | - | 84.4 | - | - | - | - |
| 2026-07-15 12:30 am | - | - | - | 2.6 | 4 | 4.1 | ESE | - | - | - | 84.4 | - | - | - | - |
| 2026-07-15 12:25 am | - | - | - | - | - | - | - | - | - | - | 84.4 | - | - | - | - |
| 2026-07-15 12:20 am | - | - | - | 2.6 | - | 4.0 | ESE | - | - | - | 84.4 | - | - | - | - |
| 2026-07-15 12:15 am | - | - | - | 2.6 | - | 4.1 | ESE | - | - | - | 84.4 | - | - | - | - |
| 2026-07-15 12:10 am | - | - | - | - | - | - | - | - | - | - | 84.4 | - | - | - | - |
| 2026-07-15 12:05 am | - | - | - | 2.6 | 4 | 4.0 | ESE | - | - | - | 84.4 | - | - | - | - |
| 2026-07-15 12:00 am | - | - | - | 2.6 | 4 | 4.1 | ESE | - | - | - | 84.4 | - | - | - | - |
| 2026-07-14 11:55 pm | - | - | - | 2.6 | - | 4.0 | ESE | - | - | - | 84.4 | - | - | - | - |
| 2026-07-14 11:50 pm | - | - | - | 2.6 | - | 4.1 | ESE | - | - | - | 84.4 | - | - | - | - |
| 2026-07-14 11:45 pm | - | - | - | 2.6 | - | 4.0 | ESE | - | - | - | 84.4 | - | - | - | - |
| 2026-07-14 11:40 pm | - | - | - | - | - | - | - | - | - | - | 84.4 | - | - | - | - |
| 2026-07-14 11:35 pm | - | - | - | - | - | - | - | - | - | - | 84.4 | - | - | - | - |
| 2026-07-14 11:30 pm | - | - | - | 2.6 | 5 | 4.0 | ESE | - | - | - | 84.4 | - | - | - | - |
| 2026-07-14 11:25 pm | - | - | - | - | - | - | - | - | - | - | 84.4 | - | - | - | - |
| 2026-07-14 11:20 pm | - | - | - | 2.6 | - | 3.9 | ESE | - | - | - | 84.4 | - | - | - | - |
| 2026-07-14 11:15 pm | - | - | - | 2.6 | - | 3.9 | ESE | - | - | - | 84.4 | - | - | - | - |
| 2026-07-14 11:10 pm | - | - | - | - | - | - | - | - | - | - | 84.4 | - | - | - | - |
| 2026-07-14 11:05 pm | - | - | - | 2.6 | 4 | 3.9 | ESE | - | - | - | 84.4 | - | - | - | - |
| 2026-07-14 11:00 pm | - | - | - | 2.6 | 5 | 3.9 | ESE | - | - | - | 84.4 | - | - | - | - |
| 2026-07-14 10:55 pm | - | - | - | 2.6 | - | 3.9 | ESE | - | - | - | 84.4 | - | - | - | - |
| 2026-07-14 10:50 pm | - | - | - | 2.6 | - | 3.9 | ESE | - | - | - | 84.4 | - | - | - | - |
| 2026-07-14 10:45 pm | - | - | - | 2.6 | - | 3.9 | ESE | - | - | - | 84.4 | - | - | - | - |
| 2026-07-14 10:40 pm | - | - | - | - | - | - | - | - | - | - | 84.4 | - | - | - | - |
| 2026-07-14 10:35 pm | - | - | - | - | - | - | - | - | - | - | 84.4 | - | - | - | - |
| 2026-07-14 10:30 pm | - | - | - | 2.6 | 4 | 3.9 | ESE | - | - | - | 84.4 | - | - | - | - |
| 2026-07-14 10:25 pm | - | - | - | - | - | - | - | - | - | - | 84.4 | - | - | - | - |
| 2026-07-14 10:20 pm | - | - | - | 3.0 | - | 4.0 | ESE | - | - | - | 84.4 | - | - | - | - |
| 2026-07-14 10:15 pm | - | - | - | 3.0 | - | 4.0 | ESE | - | - | - | 84.4 | - | - | - | - |
| 2026-07-14 10:10 pm | - | - | - | - | - | - | - | - | - | - | 84.4 | - | - | - | - |
| 2026-07-14 10:05 pm | - | - | - | 3.0 | 5 | 4.0 | ESE | - | - | - | 84.4 | - | - | - | - |
| 2026-07-14 10:00 pm | - | - | - | 3.0 | 4 | 4.0 | ESE | - | - | - | 84.4 | - | - | - | - |
| 2026-07-14 09:55 pm | - | - | - | 3.0 | - | 4.0 | ESE | - | - | - | 84.4 | - | - | - | - |
| 2026-07-14 09:50 pm | - | - | - | 3.0 | - | 4.0 | ESE | - | - | - | 84.4 | - | - | - | - |
| 2026-07-14 09:45 pm | - | - | - | 3.3 | - | 4.0 | ESE | - | - | - | 84.4 | - | - | - | - |
| 2026-07-14 09:40 pm | - | - | - | - | - | - | - | - | - | - | 84.4 | - | - | - | - |
| 2026-07-14 09:35 pm | - | - | - | - | - | - | - | - | - | - | 84.4 | - | - | - | - |
| 2026-07-14 09:30 pm | - | - | - | 3.3 | 5 | 4.0 | ESE | - | - | - | 84.4 | - | - | - | - |
| 2026-07-14 09:25 pm | - | - | - | - | - | - | - | - | - | - | 84.4 | - | - | - | - |
| 2026-07-14 09:20 pm | - | - | - | 3.3 | - | 4.0 | ESE | - | - | - | 84.4 | - | - | - | - |
| 2026-07-14 09:15 pm | - | - | - | 3.3 | - | 4.0 | ESE | - | - | - | 84.4 | - | - | - | - |
| 2026-07-14 09:10 pm | - | - | - | - | - | - | - | - | - | - | 84.4 | - | - | - | - |
| 2026-07-14 09:05 pm | - | - | - | 3.3 | 4 | 4.0 | ESE | - | - | - | 84.4 | - | - | - | - |
| 2026-07-14 09:00 pm | - | - | - | 3.3 | 5 | 4.0 | ESE | - | - | - | 84.4 | - | - | - | - |
| 2026-07-14 08:55 pm | - | - | - | 3.3 | - | 4.0 | ESE | - | - | - | 84.4 | - | - | - | - |
| 2026-07-14 08:50 pm | - | - | - | 3.3 | - | 4.0 | ESE | - | - | - | 84.4 | - | - | - | - |
| 2026-07-14 08:45 pm | - | - | - | 3.0 | - | 3.9 | ESE | - | - | - | 84.4 | - | - | - | - |
| 2026-07-14 08:40 pm | - | - | - | - | - | - | - | - | - | - | 84.4 | - | - | - | - |
| 2026-07-14 08:35 pm | - | - | - | - | - | - | - | - | - | - | 84.4 | - | - | - | - |
| 2026-07-14 08:30 pm | - | - | - | 3.0 | 4 | 3.9 | ESE | - | - | - | 84.4 | - | - | - | - |
| 2026-07-14 08:25 pm | - | - | - | - | - | - | - | - | - | - | 84.4 | - | - | - | - |
| 2026-07-14 08:20 pm | - | - | - | 3.0 | - | 3.9 | ESE | - | - | - | 84.4 | - | - | - | - |
| 2026-07-14 08:15 pm | - | - | - | 3.3 | - | 4.0 | ESE | - | - | - | 84.4 | - | - | - | - |
| 2026-07-14 08:10 pm | - | - | - | - | - | - | - | - | - | - | 84.4 | - | - | - | - |
| 2026-07-14 08:05 pm | - | - | - | 3.0 | 4 | 3.9 | ESE | - | - | - | 84.6 | - | - | - | - |
| 2026-07-14 08:00 pm | - | - | - | 3.3 | 4 | 4.0 | ESE | - | - | - | 84.6 | - | - | - | - |
| 2026-07-14 07:55 pm | - | - | - | 3.0 | - | 3.9 | ESE | - | - | - | 84.4 | - | - | - | - |
| 2026-07-14 07:50 pm | - | - | - | 3.3 | - | 4.0 | ESE | - | - | - | 84.4 | - | - | - | - |
| 2026-07-14 07:45 pm | - | - | - | 3.0 | - | 3.9 | ESE | - | - | - | 84.6 | - | - | - | - |
| 2026-07-14 07:40 pm | - | - | - | - | - | - | - | - | - | - | 84.6 | - | - | - | - |
| 2026-07-14 07:35 pm | - | - | - | - | - | - | - | - | - | - | 84.6 | - | - | - | - |
| 2026-07-14 07:30 pm | - | - | - | 3.0 | 4 | - | - | - | - | - | 84.6 | - | - | - | - |
| 2026-07-14 07:25 pm | - | - | - | - | - | - | - | - | - | - | 84.6 | - | - | - | - |
| 2026-07-14 07:20 pm | - | - | - | 3.0 | - | 3.8 | ESE | - | - | - | 84.6 | - | - | - | - |
| 2026-07-14 07:15 pm | - | - | - | 3.0 | - | 3.8 | ESE | - | - | - | 84.6 | - | - | - | - |
| 2026-07-14 07:10 pm | - | - | - | - | - | - | - | - | - | - | 84.6 | - | - | - | - |
| 2026-07-14 07:05 pm | - | - | - | 3.0 | 4 | - | - | - | - | - | 84.6 | - | - | - | - |
| 2026-07-14 07:00 pm | - | - | - | 3.0 | 4 | - | - | - | - | - | 84.6 | - | - | - | - |
| 2026-07-14 06:55 pm | - | - | - | 3.0 | - | 3.8 | ESE | - | - | - | 84.6 | - | - | - | - |
| 2026-07-14 06:50 pm | - | - | - | 3.0 | - | 3.8 | ESE | - | - | - | 84.6 | - | - | - | - |
| 2026-07-14 06:45 pm | - | - | - | 3.0 | - | 3.9 | ESE | - | - | - | 84.6 | - | - | - | - |
| 2026-07-14 06:40 pm | - | - | - | - | - | - | - | - | - | - | 84.6 | - | - | - | - |
| 2026-07-14 06:35 pm | - | - | - | - | - | - | - | - | - | - | 84.6 | - | - | - | - |
| 2026-07-14 06:30 pm | - | - | - | 3.0 | 4 | 3.9 | ESE | - | - | - | 84.6 | - | - | - | - |
| 2026-07-14 06:25 pm | - | - | - | - | - | - | - | - | - | - | 84.6 | - | - | - | - |
| 2026-07-14 06:20 pm | - | - | - | 3.0 | - | 3.8 | ESE | - | - | - | 84.6 | - | - | - | - |
| 2026-07-14 06:15 pm | - | - | - | 3.0 | - | 3.9 | ESE | - | - | - | 84.6 | - | - | - | - |
| 2026-07-14 06:10 pm | - | - | - | - | - | - | - | - | - | - | 84.6 | - | - | - | - |
| 2026-07-14 06:05 pm | - | - | - | 3.0 | 4 | 3.8 | ESE | - | - | - | 84.7 | - | - | - | - |
| 2026-07-14 06:00 pm | - | - | - | 3.0 | 4 | 3.9 | ESE | - | - | - | 84.6 | - | - | - | - |
| 2026-07-14 05:55 pm | - | - | - | 3.0 | - | 3.8 | ESE | - | - | - | 84.6 | - | - | - | - |
| 2026-07-14 05:50 pm | - | - | - | 3.0 | - | 3.9 | ESE | - | - | - | 84.6 | - | - | - | - |
| 2026-07-14 05:45 pm | - | - | - | 3.0 | - | 3.8 | ESE | - | - | - | 84.6 | - | - | - | - |
| 2026-07-14 05:40 pm | - | - | - | - | - | - | - | - | - | - | 84.7 | - | - | - | - |
| 2026-07-14 05:35 pm | - | - | - | - | - | - | - | - | - | - | 84.7 | - | - | - | - |
| 2026-07-14 05:30 pm | - | - | - | 3.0 | 4 | 3.8 | ESE | - | - | - | 84.7 | - | - | - | - |
| 2026-07-14 05:25 pm | - | - | - | - | - | - | - | - | - | - | 84.7 | - | - | - | - |
| 2026-07-14 05:20 pm | - | - | - | 3.0 | - | 3.8 | SE | - | - | - | 84.7 | - | - | - | - |
| 2026-07-14 05:15 pm | - | - | - | 3.0 | - | 3.8 | ESE | - | - | - | 84.7 | - | - | - | - |
| 2026-07-14 05:10 pm | - | - | - | - | - | - | - | - | - | - | 84.7 | - | - | - | - |
| 2026-07-14 05:05 pm | - | - | - | 3.0 | 4 | 3.8 | SE | - | - | - | 84.7 | - | - | - | - |
| 2026-07-14 05:00 pm | - | - | - | 3.0 | 4 | 3.8 | ESE | - | - | - | 84.7 | - | - | - | - |
| 2026-07-14 04:55 pm | - | - | - | 3.0 | - | 3.8 | SE | - | - | - | 84.7 | - | - | - | - |
| 2026-07-14 04:50 pm | - | - | - | 3.0 | - | 3.8 | ESE | - | - | - | 84.7 | - | - | - | - |
| 2026-07-14 04:45 pm | - | - | - | 3.0 | - | 3.8 | SE | - | - | - | 84.7 | - | - | - | - |
| 2026-07-14 04:40 pm | - | - | - | - | - | - | - | - | - | - | 84.7 | - | - | - | - |
| 2026-07-14 04:35 pm | - | - | - | - | - | - | - | - | - | - | 84.7 | - | - | - | - |
| 2026-07-14 04:30 pm | - | - | - | 3.0 | 4 | 3.8 | SE | - | - | - | 84.7 | - | - | - | - |
| 2026-07-14 04:25 pm | - | - | - | - | - | - | - | - | - | - | 84.7 | - | - | - | - |
| 2026-07-14 04:20 pm | - | - | - | 2.6 | - | 3.9 | SE | - | - | - | 84.7 | - | - | - | - |
| 2026-07-14 04:15 pm | - | - | - | 3.0 | - | 3.8 | SE | - | - | - | 84.7 | - | - | - | - |
| 2026-07-14 04:10 pm | - | - | - | - | - | - | - | - | - | - | 84.7 | - | - | - | - |
| 2026-07-14 04:05 pm | - | - | - | 2.6 | 4 | 3.9 | SE | - | - | - | 84.7 | - | - | - | - |
| 2026-07-14 04:00 pm | - | - | - | 3.0 | 4 | 3.8 | SE | - | - | - | 84.7 | - | - | - | - |
| 2026-07-14 03:55 pm | - | - | - | 2.6 | - | 3.9 | SE | - | - | - | 84.7 | - | - | - | - |
| 2026-07-14 03:50 pm | - | - | - | 3.0 | - | 3.8 | SE | - | - | - | 84.7 | - | - | - | - |
| 2026-07-14 03:45 pm | - | - | - | 2.3 | - | 4.2 | SE | - | - | - | 84.7 | - | - | - | - |
| 2026-07-14 03:40 pm | - | - | - | - | - | - | - | - | - | - | 84.7 | - | - | - | - |
| 2026-07-14 03:35 pm | - | - | - | - | - | - | - | - | - | - | 84.7 | - | - | - | - |
| 2026-07-14 03:30 pm | - | - | - | 2.3 | 4 | 4.2 | SE | - | - | - | 84.7 | - | - | - | - |
| 2026-07-14 03:25 pm | - | - | - | - | - | - | - | - | - | - | 84.7 | - | - | - | - |
| 2026-07-14 03:20 pm | - | - | - | 2.0 | - | 4.1 | SE | - | - | - | 84.7 | - | - | - | - |
| 2026-07-14 03:15 pm | - | - | - | 2.0 | - | 4.4 | SE | - | - | - | 84.7 | - | - | - | - |
| 2026-07-14 03:10 pm | - | - | - | - | - | - | - | - | - | - | 84.7 | - | - | - | - |
| 2026-07-14 03:05 pm | - | - | - | 2.0 | 6 | 4.1 | SE | - | - | - | 84.9 | - | - | - | - |
| 2026-07-14 03:00 pm | - | - | - | 2.0 | 9 | 4.4 | SE | - | - | - | 84.7 | - | - | - | - |
| 2026-07-14 02:55 pm | - | - | - | 2.0 | - | 4.1 | SE | - | - | - | 84.7 | - | - | - | - |
| 2026-07-14 02:50 pm | - | - | - | 2.0 | - | 4.4 | SE | - | - | - | 84.7 | - | - | - | - |
| 2026-07-14 02:45 pm | - | - | - | 2.0 | - | 3.7 | SE | - | - | - | 84.7 | - | - | - | - |
| 2026-07-14 02:40 pm | - | - | - | - | - | - | - | - | - | - | 84.7 | - | - | - | - |
| 2026-07-14 02:35 pm | - | - | - | - | - | - | - | - | - | - | 84.7 | - | - | - | - |
| 2026-07-14 02:30 pm | - | - | - | 2.0 | 9 | 3.7 | SE | - | - | - | 84.9 | - | - | - | - |
| 2026-07-14 02:25 pm | - | - | - | - | - | - | - | - | - | - | 84.9 | - | - | - | - |
| 2026-07-14 02:20 pm | - | - | - | 1.6 | - | 4.1 | SSE | - | - | - | 84.9 | - | - | - | - |
| 2026-07-14 02:15 pm | - | - | - | 2.0 | - | 3.8 | SE | - | - | - | 85.1 | - | - | - | - |
| 2026-07-14 02:10 pm | - | - | - | - | - | - | - | - | - | - | 85.1 | - | - | - | - |
| 2026-07-14 02:05 pm | - | - | - | 1.6 | 7 | 4.1 | SSE | - | - | - | 85.5 | - | - | - | - |
| 2026-07-14 02:00 pm | - | - | - | 2.0 | 7 | 3.8 | SE | - | - | - | 85.1 | - | - | - | - |
| 2026-07-14 01:55 pm | - | - | - | 1.6 | - | 4.1 | SSE | - | - | - | 85.3 | - | - | - | - |
| 2026-07-14 01:50 pm | - | - | - | 2.0 | - | 3.8 | SE | - | - | - | 85.3 | - | - | - | - |
| 2026-07-14 01:45 pm | - | - | - | 1.6 | - | 4.6 | SSE | - | - | - | 85.3 | - | - | - | - |
| 2026-07-14 01:40 pm | - | - | - | - | - | - | - | - | - | - | 85.5 | - | - | - | - |
| 2026-07-14 01:35 pm | - | - | - | - | - | - | - | - | - | - | 85.5 | - | - | - | - |
| 2026-07-14 01:30 pm | - | - | - | 1.6 | 9 | 4.6 | SSE | - | - | - | 85.6 | - | - | - | - |
| 2026-07-14 01:25 pm | - | - | - | - | - | - | - | - | - | - | 85.8 | - | - | - | - |
| 2026-07-14 01:20 pm | - | - | - | 1.6 | - | 4.7 | SE | - | - | - | 85.8 | - | - | - | - |
| 2026-07-14 01:15 pm | - | - | - | 1.6 | - | 4.7 | SE | - | - | - | 85.8 | - | - | - | - |
| 2026-07-14 01:10 pm | - | - | - | - | - | - | - | - | - | - | 85.8 | - | - | - | - |
| 2026-07-14 01:05 pm | - | - | - | 1.6 | 9 | 4.7 | SE | - | - | - | 85.6 | - | - | - | - |
| 2026-07-14 01:00 pm | - | - | - | 1.6 | 7 | 4.7 | SE | - | - | - | 85.6 | - | - | - | - |
| 2026-07-14 12:55 pm | - | - | - | 1.6 | - | 4.7 | SE | - | - | - | 85.5 | - | - | - | - |
| 2026-07-14 12:50 pm | - | - | - | 1.6 | - | 4.7 | SE | - | - | - | 85.5 | - | - | - | - |
| 2026-07-14 12:45 pm | - | - | - | 1.3 | - | 4.5 | SE | - | - | - | 85.5 | - | - | - | - |
| 2026-07-14 12:40 pm | - | - | - | - | - | - | - | - | - | - | 85.6 | - | - | - | - |
| 2026-07-14 12:35 pm | - | - | - | - | - | - | - | - | - | - | 85.6 | - | - | - | - |
| 2026-07-14 12:30 pm | - | - | - | 1.3 | 9 | 4.5 | SE | - | - | - | 85.6 | - | - | - | - |
| 2026-07-14 12:25 pm | - | - | - | - | - | - | - | - | - | - | 85.8 | - | - | - | - |
| 2026-07-14 12:20 pm | - | - | - | 1.3 | - | 4.2 | SE | - | - | - | 85.8 | - | - | - | - |
| 2026-07-14 12:15 pm | - | - | - | 1.3 | - | 4.3 | SE | - | - | - | 85.6 | - | - | - | - |
| 2026-07-14 12:10 pm | - | - | - | - | - | - | - | - | - | - | 85.6 | - | - | - | - |
| 2026-07-14 12:05 pm | - | - | - | 1.3 | 9 | 4.2 | SE | - | - | - | 85.3 | - | - | - | - |
| 2026-07-14 12:00 pm | - | - | - | 1.3 | 9 | 4.3 | SE | - | - | - | 85.5 | - | - | - | - |
| 2026-07-14 11:55 am | - | - | - | 1.3 | - | 4.2 | SE | - | - | - | 85.5 | - | - | - | - |
| 2026-07-14 11:50 am | - | - | - | 1.3 | - | 4.3 | SE | - | - | - | 85.3 | - | - | - | - |
| 2026-07-14 11:45 am | - | - | - | 1.3 | - | 4.1 | SE | - | - | - | 85.3 | - | - | - | - |
| 2026-07-14 11:40 am | - | - | - | - | - | - | - | - | - | - | 85.3 | - | - | - | - |
| 2026-07-14 11:35 am | - | - | - | - | - | - | - | - | - | - | 85.3 | - | - | - | - |
| 2026-07-14 11:30 am | - | - | - | 1.3 | 9 | 4.1 | SE | - | - | - | 85.1 | - | - | - | - |
| 2026-07-14 11:25 am | - | - | - | - | - | - | - | - | - | - | 85.1 | - | - | - | - |
| 2026-07-14 11:20 am | - | - | - | 1.6 | - | 4.1 | SE | - | - | - | 85.1 | - | - | - | - |
| 2026-07-14 11:15 am | - | - | - | 1.3 | - | 4.2 | SE | - | - | - | 84.9 | - | - | - | - |
| 2026-07-14 11:10 am | - | - | - | - | - | - | - | - | - | - | 84.9 | - | - | - | - |
| 2026-07-14 11:05 am | - | - | - | 1.6 | 9 | 4.1 | SE | - | - | - | 84.7 | - | - | - | - |
| 2026-07-14 11:00 am | - | - | - | 1.3 | 9 | 4.2 | SE | - | - | - | 84.9 | - | - | - | - |
| 2026-07-14 10:55 am | - | - | - | 1.6 | - | 4.1 | SE | - | - | - | 84.9 | - | - | - | - |
| 2026-07-14 10:50 am | - | - | - | 1.3 | - | 4.2 | SE | - | - | - | 84.9 | - | - | - | - |
| 2026-07-14 10:45 am | - | - | - | 1.6 | - | 3.9 | ESE | - | - | - | 84.9 | - | - | - | - |
| 2026-07-14 10:40 am | - | - | - | - | - | - | - | - | - | - | 84.7 | - | - | - | - |
| 2026-07-14 10:35 am | - | - | - | - | - | - | - | - | - | - | 84.7 | - | - | - | - |
| 2026-07-14 10:30 am | - | - | - | 1.6 | 9 | 3.9 | ESE | - | - | - | 84.7 | - | - | - | - |
| 2026-07-14 10:25 am | - | - | - | - | - | - | - | - | - | - | 84.7 | - | - | - | - |
| 2026-07-14 10:20 am | - | - | - | 1.6 | - | 4.0 | ESE | - | - | - | 84.7 | - | - | - | - |
| 2026-07-14 10:15 am | - | - | - | 1.6 | - | 4.1 | ESE | - | - | - | 84.7 | - | - | - | - |
| 2026-07-14 10:10 am | - | - | - | - | - | - | - | - | - | - | 84.7 | - | - | - | - |
| 2026-07-14 10:05 am | - | - | - | 1.6 | 9 | 4.0 | ESE | - | - | - | 84.6 | - | - | - | - |
| 2026-07-14 10:00 am | - | - | - | 1.6 | 9 | 4.1 | ESE | - | - | - | 84.6 | - | - | - | - |
| 2026-07-14 09:55 am | - | - | - | 1.6 | - | 4.0 | ESE | - | - | - | 84.6 | - | - | - | - |
| 2026-07-14 09:50 am | - | - | - | 1.6 | - | 4.1 | ESE | - | - | - | 84.6 | - | - | - | - |
|
These wave data are displayed in rounded times. Click on the graph icon in the table below to see a time series plot of the last five days of that observation. | |
| 1.6 ft | |
| 4.0 sec | |
| TIME (EDT) |
WVHT ft |
SwH ft |
SwP sec |
SwD |
WWH ft |
WWP sec |
WWD |
STEEPNESS |
APD sec |
|---|---|---|---|---|---|---|---|---|---|
| 2026-07-15 09:05 am | 1.6 | - | - | - | - | - | - | N/A | 3.9 |
| 2026-07-15 09:00 am | 1.6 | - | - | - | - | - | - | N/A | 3.8 |
| 2026-07-15 08:30 am | 2.0 | - | - | - | - | - | - | N/A | 4.1 |
| 2026-07-15 08:05 am | 2.0 | - | - | - | - | - | - | N/A | 3.8 |
| 2026-07-15 08:00 am | 1.6 | - | - | - | - | - | - | N/A | 3.8 |
| 2026-07-15 07:30 am | 2.0 | - | - | - | - | - | - | N/A | 3.8 |
| 2026-07-15 07:05 am | 2.0 | - | - | - | - | - | - | N/A | 3.7 |
| 2026-07-15 07:00 am | 1.6 | - | - | - | - | - | - | N/A | 3.7 |
| 2026-07-15 06:30 am | 1.6 | - | - | - | - | - | - | N/A | 3.6 |
| 2026-07-15 06:05 am | 1.6 | - | - | - | - | - | - | N/A | 3.8 |
| 2026-07-15 06:00 am | 1.6 | - | - | - | - | - | - | N/A | 3.7 |
| 2026-07-15 05:30 am | 1.6 | - | - | - | - | - | - | N/A | 3.9 |
| 2026-07-15 05:05 am | 1.6 | - | - | - | - | - | - | N/A | 3.9 |
| 2026-07-15 05:00 am | 1.6 | - | - | - | - | - | - | N/A | 4.1 |
| 2026-07-15 04:30 am | 1.6 | - | - | - | - | - | - | N/A | 3.8 |
| 2026-07-15 04:05 am | 2.0 | - | - | - | - | - | - | N/A | 3.9 |
| 2026-07-15 04:00 am | 2.0 | - | - | - | - | - | - | N/A | 4.1 |
| 2026-07-15 03:30 am | 1.6 | - | - | - | - | - | - | N/A | 3.7 |
| 2026-07-15 03:05 am | 2.0 | - | - | - | - | - | - | N/A | 4.0 |
| 2026-07-15 03:00 am | 2.0 | - | - | - | - | - | - | N/A | 4.1 |
| 2026-07-15 02:30 am | 2.0 | - | - | - | - | - | - | N/A | 4.0 |
| 2026-07-15 02:05 am | 2.3 | - | - | - | - | - | - | N/A | 4.0 |
| 2026-07-15 02:00 am | 2.0 | - | - | - | - | - | - | N/A | 4.0 |
| 2026-07-15 01:30 am | 2.0 | - | - | - | - | - | - | N/A | 4.0 |
| 2026-07-15 01:05 am | 2.3 | - | - | - | - | - | - | N/A | 4.0 |
| 2026-07-15 01:00 am | 2.3 | - | - | - | - | - | - | N/A | 4.0 |
| 2026-07-15 12:30 am | 2.6 | - | - | - | - | - | - | N/A | 4.1 |
| 2026-07-15 12:05 am | 2.6 | - | - | - | - | - | - | N/A | 4.0 |
| 2026-07-15 12:00 am | 2.6 | - | - | - | - | - | - | N/A | 4.1 |
| 2026-07-14 11:30 pm | 2.6 | - | - | - | - | - | - | N/A | 4.0 |
| 2026-07-14 11:05 pm | 2.6 | - | - | - | - | - | - | VERY_STEEP | 3.9 |
| 2026-07-14 11:00 pm | 2.6 | - | - | - | - | - | - | N/A | 3.9 |
| 2026-07-14 10:30 pm | 2.6 | - | - | - | - | - | - | VERY_STEEP | 3.9 |
| 2026-07-14 10:05 pm | 3.0 | - | - | - | - | - | - | VERY_STEEP | 4.0 |
| 2026-07-14 10:00 pm | 3.0 | - | - | - | - | - | - | VERY_STEEP | 4.0 |
| 2026-07-14 09:30 pm | 3.3 | - | - | - | - | - | - | VERY_STEEP | 4.0 |
| 2026-07-14 09:05 pm | 3.3 | - | - | - | - | - | - | VERY_STEEP | 4.0 |
| 2026-07-14 09:00 pm | 3.3 | - | - | - | - | - | - | VERY_STEEP | 4.0 |
| 2026-07-14 08:30 pm | 3.0 | - | - | - | - | - | - | VERY_STEEP | 3.9 |
| 2026-07-14 08:05 pm | 3.0 | - | - | - | - | - | - | VERY_STEEP | 3.9 |
| 2026-07-14 08:00 pm | 3.3 | - | - | - | - | - | - | VERY_STEEP | 4.0 |
| 2026-07-14 07:30 pm | 3.0 | - | - | - | - | - | - | VERY_STEEP | 3.9 |
| 2026-07-14 07:05 pm | 3.0 | - | - | - | - | - | - | VERY_STEEP | 3.8 |
| 2026-07-14 07:00 pm | 3.0 | - | - | - | - | - | - | VERY_STEEP | 3.8 |
| 2026-07-14 06:30 pm | 3.0 | - | - | - | - | - | - | VERY_STEEP | 3.9 |
| 2026-07-14 06:05 pm | 3.0 | - | - | - | - | - | - | VERY_STEEP | 3.8 |
| 2026-07-14 06:00 pm | 3.0 | - | - | - | - | - | - | VERY_STEEP | 3.9 |
| 2026-07-14 05:30 pm | 3.0 | - | - | - | - | - | - | VERY_STEEP | 3.8 |
| 2026-07-14 05:05 pm | 3.0 | - | - | - | - | - | - | VERY_STEEP | 3.8 |
| 2026-07-14 05:00 pm | 3.0 | - | - | - | - | - | - | VERY_STEEP | 3.8 |
| 2026-07-14 04:30 pm | 3.0 | - | - | - | - | - | - | VERY_STEEP | 3.8 |
| 2026-07-14 04:05 pm | 2.6 | - | - | - | - | - | - | VERY_STEEP | 3.9 |
| 2026-07-14 04:00 pm | 3.0 | - | - | - | - | - | - | VERY_STEEP | 3.8 |
| 2026-07-14 03:30 pm | 2.3 | - | - | - | - | - | - | N/A | 4.2 |
| 2026-07-14 03:05 pm | 2.0 | - | - | - | - | - | - | N/A | 4.1 |
| 2026-07-14 03:00 pm | 2.0 | - | - | - | - | - | - | N/A | 4.4 |
| 2026-07-14 02:30 pm | 2.0 | - | - | - | - | - | - | N/A | 3.7 |
| 2026-07-14 02:05 pm | 1.6 | - | - | - | - | - | - | N/A | 4.1 |
| 2026-07-14 02:00 pm | 2.0 | - | - | - | - | - | - | N/A | 3.8 |
| 2026-07-14 01:30 pm | 1.6 | - | - | - | - | - | - | N/A | 4.6 |
| 2026-07-14 01:05 pm | 1.6 | - | - | - | - | - | - | N/A | 4.7 |
| 2026-07-14 01:00 pm | 1.6 | - | - | - | - | - | - | N/A | 4.7 |
| 2026-07-14 12:30 pm | 1.3 | - | - | - | - | - | - | N/A | 4.5 |
| 2026-07-14 12:05 pm | 1.3 | - | - | - | - | - | - | N/A | 4.2 |
| 2026-07-14 12:00 pm | 1.3 | - | - | - | - | - | - | N/A | 4.3 |
| 2026-07-14 11:30 am | 1.3 | - | - | - | - | - | - | N/A | 4.1 |
| 2026-07-14 11:05 am | 1.6 | - | - | - | - | - | - | N/A | 4.1 |
| 2026-07-14 11:00 am | 1.3 | - | - | - | - | - | - | N/A | 4.2 |
| 2026-07-14 10:30 am | 1.6 | - | - | - | - | - | - | N/A | 3.9 |
| 2026-07-14 10:05 am | 1.6 | - | - | - | - | - | - | N/A | 4.0 |
| 2026-07-14 10:00 am | 1.6 | - | - | - | - | - | - | N/A | 4.1 |
Links which are specific to this station are listed below:
Real Time Data in tabular form for the last forty-five days.
Historical Data & Climatic Summaries for quality controlled data for prior months and years.