


![]() View the latest observations near Central Pacific Tropical Storm Fausto and East Pacific Hurricane Genevieve.
View the latest observations near Central Pacific Tropical Storm Fausto and East Pacific Hurricane Genevieve.
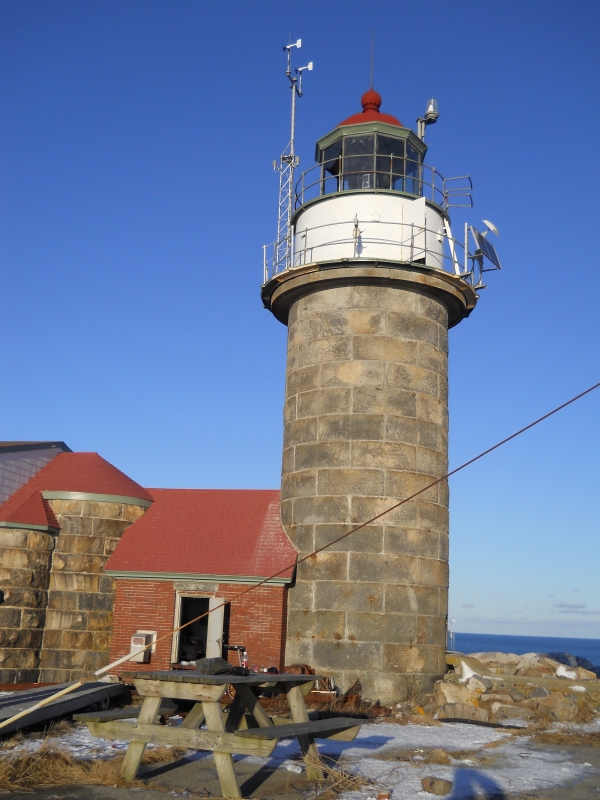
Station MISM1 - Matinicus Rock, ME 
Owned and maintained by National Data Buoy Center
C-MAN Station
SM+ Payload
43.784 N 68.855 W (43°47'1" N 68°51'18" W)
Site elevation: 16.2 m above mean sea level
Air temp height: 3.8 m above site elevation
Anemometer height: 7.1 m above site elevation
Barometer elevation: 16.8 m above mean sea level
Meteorological Observations from Nearby Stations and Ships
![]()
(24 hours for tsunami stations)
|
Click on the graph icon in the table below to see a time series plot of the last five days of that observation. | |
| SSE ( 150 deg true ) | |
| 10 kts | |
| 10 kts | |
| 29.77 in | |
| -0.02 in ( Falling ) | |
| 59.9 °F | |
| 59.0 °F | |
| 10 kts | |
| 12 kts | |
|
||||||||||||||||||
| TIME (EDT) |
WDIR |
WSPD kts |
GST kts |
WVHT ft |
DPD sec |
APD sec |
MWD |
PRES in |
PTDY in |
ATMP °F |
WTMP °F |
DEWP °F |
SAL psu |
VIS nmi |
TIDE ft |
|---|---|---|---|---|---|---|---|---|---|---|---|---|---|---|---|
| 2026-07-28 04:50 am | SE | 8 | 10 | - | - | - | - | 29.77 | - | 61.2 | - | 58.5 | - | - | - |
| 2026-07-28 04:40 am | SE | 7 | 7 | - | - | - | - | 29.77 | - | 61.2 | - | 58.3 | - | - | - |
| 2026-07-28 04:30 am | SSE | 8 | 8 | - | - | - | - | 29.77 | - | 60.8 | - | 58.5 | - | - | - |
| 2026-07-28 04:20 am | SE | 8 | 9 | - | - | - | - | 29.77 | - | 59.7 | - | 58.6 | - | - | - |
| 2026-07-28 04:10 am | SSE | 8 | 9 | - | - | - | - | 29.77 | - | 59.0 | - | 58.3 | - | - | - |
| 2026-07-28 04:00 am | SSE | 7 | 8 | - | - | - | - | 29.78 | -0.04 | 59.9 | - | 58.1 | - | - | - |
| 2026-07-28 03:50 am | SE | 6 | 7 | - | - | - | - | 29.77 | - | 60.4 | - | 57.7 | - | - | - |
| 2026-07-28 03:40 am | SE | 5 | 5 | - | - | - | - | 29.77 | - | 60.6 | - | 57.6 | - | - | - |
| 2026-07-28 03:30 am | ESE | 4 | 5 | - | - | - | - | 29.77 | - | 60.6 | - | 57.0 | - | - | - |
| 2026-07-28 03:20 am | SE | 5 | 6 | - | - | - | - | 29.76 | - | 60.4 | - | 57.2 | - | - | - |
| 2026-07-28 03:10 am | SE | 5 | 6 | - | - | - | - | 29.77 | - | 60.1 | - | 57.2 | - | - | - |
| 2026-07-28 03:00 am | SE | 5 | 6 | - | - | - | - | 29.77 | -0.04 | 60.1 | - | 57.0 | - | - | - |
| 2026-07-28 02:50 am | ESE | 3 | 4 | - | - | - | - | 29.78 | - | 60.1 | - | 57.0 | - | - | - |
| 2026-07-28 02:40 am | E | 3 | 4 | - | - | - | - | 29.78 | - | 60.3 | - | 57.0 | - | - | - |
| 2026-07-28 02:30 am | - | 0 | 3 | - | - | - | - | 29.78 | - | 61.5 | - | 56.3 | - | - | - |
| 2026-07-28 02:20 am | NW | 2 | 4 | - | - | - | - | 29.79 | - | 62.4 | - | 56.5 | - | - | - |
| 2026-07-28 02:10 am | NW | 3 | 4 | - | - | - | - | 29.79 | - | 62.4 | - | 56.3 | - | - | - |
| 2026-07-28 02:00 am | WNW | 5 | 6 | - | - | - | - | 29.79 | -0.03 | 62.8 | - | 56.3 | - | - | - |
| 2026-07-28 01:50 am | W | 7 | 7 | - | - | - | - | 29.79 | - | 62.6 | - | 56.1 | - | - | - |
| 2026-07-28 01:40 am | W | 8 | 9 | - | - | - | - | 29.79 | - | 62.6 | - | 56.3 | - | - | - |
| 2026-07-28 01:30 am | W | 7 | 9 | - | - | - | - | 29.80 | - | 62.2 | - | 56.1 | - | - | - |
| 2026-07-28 01:20 am | W | 5 | 7 | - | - | - | - | 29.80 | - | 61.7 | - | 56.7 | - | - | - |
| 2026-07-28 01:10 am | W | 6 | 7 | - | - | - | - | 29.81 | - | 61.5 | - | 57.0 | - | - | - |
| 2026-07-28 01:00 am | W | 7 | 9 | - | - | - | - | 29.81 | +0.00 | 61.2 | - | 57.9 | - | - | - |
| 2026-07-28 12:50 am | W | 9 | 10 | - | - | - | - | 29.81 | - | 61.3 | - | 58.1 | - | - | - |
| 2026-07-28 12:40 am | W | 8 | 9 | - | - | - | - | 29.81 | - | 61.9 | - | 57.9 | - | - | - |
| 2026-07-28 12:30 am | W | 10 | 11 | - | - | - | - | 29.81 | - | 62.1 | - | 57.9 | - | - | - |
| 2026-07-28 12:20 am | W | 11 | 12 | - | - | - | - | 29.81 | - | 62.1 | - | 58.1 | - | - | - |
| 2026-07-28 12:10 am | W | 12 | 12 | - | - | - | - | 29.81 | - | 61.7 | - | 58.3 | - | - | - |
| 2026-07-28 12:00 am | W | 11 | 12 | - | - | - | - | 29.81 | +0.00 | 61.7 | - | 58.3 | - | - | - |
| 2026-07-27 11:50 pm | W | 10 | 10 | - | - | - | - | 29.81 | - | 61.7 | - | 57.6 | - | - | - |
| 2026-07-27 11:40 pm | W | 8 | 9 | - | - | - | - | 29.81 | - | 61.7 | - | 57.2 | - | - | - |
| 2026-07-27 11:30 pm | W | 8 | 8 | - | - | - | - | 29.81 | - | 61.7 | - | 56.8 | - | - | - |
| 2026-07-27 11:20 pm | W | 9 | 9 | - | - | - | - | 29.81 | - | 61.9 | - | 56.3 | - | - | - |
| 2026-07-27 11:10 pm | W | 9 | 10 | - | - | - | - | 29.81 | - | 61.7 | - | 56.3 | - | - | - |
| 2026-07-27 11:00 pm | W | 9 | 10 | - | - | - | - | 29.81 | +0.03 | 61.5 | - | 56.3 | - | - | - |
| 2026-07-27 10:50 pm | W | 9 | 9 | - | - | - | - | 29.81 | - | 61.2 | - | 56.8 | - | - | - |
| 2026-07-27 10:40 pm | W | 9 | 9 | - | - | - | - | 29.81 | - | 61.5 | - | 55.9 | - | - | - |
| 2026-07-27 10:30 pm | W | 8 | 9 | - | - | - | - | 29.81 | - | 61.9 | - | 55.2 | - | - | - |
| 2026-07-27 10:20 pm | W | 9 | 9 | - | - | - | - | 29.81 | - | 62.4 | - | 53.1 | - | - | - |
| 2026-07-27 10:10 pm | WSW | 9 | 9 | - | - | - | - | 29.80 | - | 62.6 | - | 51.3 | - | - | - |
| 2026-07-27 10:00 pm | WSW | 9 | 9 | - | - | - | - | 29.81 | +0.03 | 61.7 | - | 55.4 | - | - | - |
| 2026-07-27 09:50 pm | WSW | 9 | 9 | - | - | - | - | 29.81 | - | 62.1 | - | 54.0 | - | - | - |
| 2026-07-27 09:40 pm | WSW | 8 | 9 | - | - | - | - | 29.81 | - | 62.6 | - | 51.4 | - | - | - |
| 2026-07-27 09:30 pm | WSW | 6 | 7 | - | - | - | - | 29.81 | - | 62.8 | - | 51.3 | - | - | - |
| 2026-07-27 09:20 pm | WSW | 7 | 7 | - | - | - | - | 29.81 | - | 62.1 | - | 54.3 | - | - | - |
| 2026-07-27 09:10 pm | SW | 7 | 7 | - | - | - | - | 29.81 | - | 62.1 | - | 54.1 | - | - | - |
| 2026-07-27 09:00 pm | SW | 6 | 7 | - | - | - | - | 29.80 | +0.02 | 62.1 | - | 54.1 | - | - | - |
| 2026-07-27 08:50 pm | SW | 6 | 6 | - | - | - | - | 29.80 | - | 62.2 | - | 51.4 | - | - | - |
| 2026-07-27 08:40 pm | SSW | 5 | 6 | - | - | - | - | 29.79 | - | 62.4 | - | 51.1 | - | - | - |
| 2026-07-27 08:30 pm | SSW | 5 | 6 | - | - | - | - | 29.79 | - | 62.4 | - | 51.3 | - | - | - |
| 2026-07-27 08:20 pm | SSW | 5 | 6 | - | - | - | - | 29.79 | - | 62.6 | - | 50.2 | - | - | - |
| 2026-07-27 08:10 pm | SW | 6 | 6 | - | - | - | - | 29.79 | - | 62.6 | - | 50.9 | - | - | - |
| 2026-07-27 08:00 pm | SW | 5 | 5 | - | - | - | - | 29.78 | +0.00 | 61.9 | - | 53.4 | - | - | - |
| 2026-07-27 07:50 pm | SW | 6 | 6 | - | - | - | - | 29.79 | - | 62.4 | - | 53.2 | - | - | - |
| 2026-07-27 07:40 pm | SW | 5 | 6 | - | - | - | - | 29.79 | - | 62.1 | - | 55.0 | - | - | - |
| 2026-07-27 07:30 pm | WSW | 5 | 5 | - | - | - | - | 29.79 | - | 62.1 | - | 57.2 | - | - | - |
| 2026-07-27 07:20 pm | WSW | 5 | 6 | - | - | - | - | 29.79 | - | 62.1 | - | 57.6 | - | - | - |
| 2026-07-27 07:10 pm | WSW | 5 | 6 | - | - | - | - | 29.79 | - | 62.2 | - | 56.5 | - | - | - |
| 2026-07-27 07:00 pm | W | 5 | 5 | - | - | - | - | 29.78 | -0.01 | 62.2 | - | 56.3 | - | - | - |
| 2026-07-27 06:50 pm | W | 5 | 6 | - | - | - | - | 29.78 | - | 62.6 | - | 55.2 | - | - | - |
| 2026-07-27 06:40 pm | W | 5 | 6 | - | - | - | - | 29.79 | - | 62.8 | - | 54.7 | - | - | - |
| 2026-07-27 06:30 pm | WSW | 5 | 6 | - | - | - | - | 29.79 | - | 63.3 | - | 53.6 | - | - | - |
| 2026-07-27 06:20 pm | SW | 4 | 5 | - | - | - | - | 29.79 | - | 63.5 | - | 53.1 | - | - | - |
| 2026-07-27 06:10 pm | WSW | 5 | 6 | - | - | - | - | 29.78 | - | 62.8 | - | 54.0 | - | - | - |
| 2026-07-27 06:00 pm | WSW | 5 | 6 | - | - | - | - | 29.78 | -0.02 | 62.8 | - | 55.0 | - | - | - |
| 2026-07-27 05:50 pm | WSW | 5 | 6 | - | - | - | - | 29.78 | - | 62.6 | - | 55.6 | - | - | - |
| 2026-07-27 05:40 pm | SW | 6 | 7 | - | - | - | - | 29.78 | - | 62.6 | - | 55.2 | - | - | - |
| 2026-07-27 05:30 pm | SSW | 5 | 6 | - | - | - | - | 29.78 | - | 63.0 | - | 53.4 | - | - | - |
| 2026-07-27 05:20 pm | S | 6 | 6 | - | - | - | - | 29.78 | - | 62.6 | - | 52.3 | - | - | - |
| 2026-07-27 05:10 pm | S | 6 | 7 | - | - | - | - | 29.78 | - | 62.4 | - | 52.9 | - | - | - |
| 2026-07-27 05:00 pm | S | 6 | 7 | - | - | - | - | 29.78 | -0.05 | 62.4 | - | 53.8 | - | - | - |
| 2026-07-27 04:50 pm | S | 6 | 6 | - | - | - | - | 29.78 | - | 62.2 | - | 53.8 | - | - | - |
| 2026-07-27 04:40 pm | SSE | 7 | 7 | - | - | - | - | 29.78 | - | 62.2 | - | 52.7 | - | - | - |
| 2026-07-27 04:30 pm | S | 6 | 7 | - | - | - | - | 29.78 | - | 62.4 | - | 52.0 | - | - | - |
| 2026-07-27 04:20 pm | S | 6 | 7 | - | - | - | - | 29.79 | - | 62.6 | - | 52.7 | - | - | - |
| 2026-07-27 04:10 pm | S | 7 | 7 | - | - | - | - | 29.79 | - | 62.2 | - | 53.4 | - | - | - |
| 2026-07-27 04:00 pm | S | 7 | 8 | - | - | - | - | 29.79 | -0.04 | 62.2 | - | 52.2 | - | - | - |
| 2026-07-27 03:50 pm | SSE | 7 | 8 | - | - | - | - | 29.79 | - | 62.1 | - | 53.6 | - | - | - |
| 2026-07-27 03:40 pm | SSE | 6 | 6 | - | - | - | - | 29.80 | - | 62.2 | - | 53.6 | - | - | - |
| 2026-07-27 03:30 pm | SSE | 5 | 6 | - | - | - | - | 29.80 | - | 62.2 | - | 53.4 | - | - | - |
| 2026-07-27 03:20 pm | SE | 5 | 6 | - | - | - | - | 29.80 | - | 62.1 | - | 53.4 | - | - | - |
| 2026-07-27 03:10 pm | SE | 4 | 5 | - | - | - | - | 29.80 | - | 62.1 | - | 52.9 | - | - | - |
| 2026-07-27 03:00 pm | SSE | 5 | 5 | - | - | - | - | 29.80 | -0.03 | 62.1 | - | 53.2 | - | - | - |
| 2026-07-27 02:50 pm | SE | 5 | 6 | - | - | - | - | 29.81 | - | 61.9 | - | 52.9 | - | - | - |
| 2026-07-27 02:40 pm | SE | 6 | 6 | - | - | - | - | 29.81 | - | 61.7 | - | 52.2 | - | - | - |
| 2026-07-27 02:30 pm | SE | 5 | 5 | - | - | - | - | 29.81 | - | 61.5 | - | 52.3 | - | - | - |
| 2026-07-27 02:20 pm | SE | 4 | 4 | - | - | - | - | 29.82 | - | 61.5 | - | 53.8 | - | - | - |
| 2026-07-27 02:10 pm | ESE | 4 | 4 | - | - | - | - | 29.82 | - | 61.2 | - | 53.8 | - | - | - |
| 2026-07-27 02:00 pm | SE | 3 | 4 | - | - | - | - | 29.83 | -0.02 | 61.3 | - | 54.0 | - | - | - |
| 2026-07-27 01:50 pm | ESE | 3 | 4 | - | - | - | - | 29.83 | - | 61.2 | - | 53.2 | - | - | - |
| 2026-07-27 01:40 pm | ESE | 3 | 4 | - | - | - | - | 29.83 | - | 61.3 | - | 53.4 | - | - | - |
| 2026-07-27 01:30 pm | ESE | 4 | 5 | - | - | - | - | 29.83 | - | 61.0 | - | 52.9 | - | - | - |
| 2026-07-27 01:20 pm | ESE | 5 | 5 | - | - | - | - | 29.84 | - | 61.0 | - | 52.7 | - | - | - |
| 2026-07-27 01:10 pm | ESE | 5 | 6 | - | - | - | - | 29.83 | - | 60.8 | - | 53.2 | - | - | - |
| 2026-07-27 01:00 pm | E | 5 | 6 | - | - | - | - | 29.83 | -0.01 | 60.8 | - | 53.2 | - | - | - |
| 2026-07-27 12:50 pm | E | 4 | 5 | - | - | - | - | 29.84 | - | 61.0 | - | 53.1 | - | - | - |
| 2026-07-27 12:40 pm | E | 3 | 4 | - | - | - | - | 29.84 | - | 61.2 | - | 52.9 | - | - | - |
| 2026-07-27 12:30 pm | ENE | 4 | 5 | - | - | - | - | 29.84 | - | 60.6 | - | 52.5 | - | - | - |
| 2026-07-27 12:20 pm | ENE | 5 | 6 | - | - | - | - | 29.84 | - | 60.4 | - | 52.5 | - | - | - |
| 2026-07-27 12:10 pm | ENE | 6 | 7 | - | - | - | - | 29.84 | - | 60.3 | - | 52.7 | - | - | - |
| 2026-07-27 12:00 pm | ENE | 6 | 7 | - | - | - | - | 29.84 | -0.01 | 60.1 | - | 52.7 | - | - | - |
| 2026-07-27 11:50 am | E | 6 | 8 | - | - | - | - | 29.84 | - | 59.9 | - | 53.4 | - | - | - |
| 2026-07-27 11:40 am | E | 7 | 8 | - | - | - | - | 29.84 | - | 59.7 | - | 54.1 | - | - | - |
| 2026-07-27 11:30 am | E | 6 | 7 | - | - | - | - | 29.84 | - | 59.5 | - | 54.5 | - | - | - |
| 2026-07-27 11:20 am | ENE | 6 | 7 | - | - | - | - | 29.85 | - | 59.4 | - | 54.5 | - | - | - |
| 2026-07-27 11:10 am | NE | 5 | 6 | - | - | - | - | 29.84 | - | 59.7 | - | 54.7 | - | - | - |
| 2026-07-27 11:00 am | ENE | 5 | 7 | - | - | - | - | 29.85 | +0.00 | 59.7 | - | 54.5 | - | - | - |
| 2026-07-27 10:50 am | NE | 5 | 7 | - | - | - | - | 29.85 | - | 60.4 | - | 54.5 | - | - | - |
| 2026-07-27 10:40 am | NE | 6 | 7 | - | - | - | - | 29.84 | - | 59.9 | - | 54.1 | - | - | - |
| 2026-07-27 10:30 am | NE | 7 | 8 | - | - | - | - | 29.84 | - | 59.4 | - | 54.0 | - | - | - |
| 2026-07-27 10:20 am | NE | 6 | 8 | - | - | - | - | 29.84 | - | 59.9 | - | 54.3 | - | - | - |
| 2026-07-27 10:10 am | NE | 6 | 8 | - | - | - | - | 29.84 | - | 59.7 | - | 54.3 | - | - | - |
| 2026-07-27 10:00 am | NE | 7 | 8 | - | - | - | - | 29.84 | +0.00 | 59.2 | - | 53.8 | - | - | - |
| 2026-07-27 09:50 am | NE | 8 | 9 | - | - | - | - | 29.84 | - | 59.2 | - | 53.6 | - | - | - |
| 2026-07-27 09:40 am | NE | 8 | 9 | - | - | - | - | 29.84 | - | 59.4 | - | 53.8 | - | - | - |
| 2026-07-27 09:30 am | NE | 8 | 9 | - | - | - | - | 29.84 | - | 59.4 | - | 54.1 | - | - | - |
| 2026-07-27 09:20 am | NE | 6 | 8 | - | - | - | - | 29.84 | - | 59.7 | - | 54.5 | - | - | - |
| 2026-07-27 09:10 am | NE | 7 | 8 | - | - | - | - | 29.84 | - | 59.7 | - | 54.1 | - | - | - |
| 2026-07-27 09:00 am | NE | 7 | 8 | - | - | - | - | 29.85 | +0.01 | 59.7 | - | 54.1 | - | - | - |
| 2026-07-27 08:50 am | NE | 7 | 8 | - | - | - | - | 29.85 | - | 59.7 | - | 54.5 | - | - | - |
| 2026-07-27 08:40 am | NE | 6 | 8 | - | - | - | - | 29.85 | - | 60.3 | - | 54.7 | - | - | - |
| 2026-07-27 08:30 am | NNE | 5 | 7 | - | - | - | - | 29.85 | - | 59.5 | - | 55.8 | - | - | - |
| 2026-07-27 08:20 am | N | 6 | 7 | - | - | - | - | 29.85 | - | 59.0 | - | 55.4 | - | - | - |
| 2026-07-27 08:10 am | N | 6 | 7 | - | - | - | - | 29.85 | - | 59.2 | - | 54.9 | - | - | - |
| 2026-07-27 08:00 am | N | 6 | 7 | - | - | - | - | 29.85 | +0.03 | 59.7 | - | 54.0 | - | - | - |
| 2026-07-27 07:50 am | N | 6 | 6 | - | - | - | - | 29.85 | - | 59.5 | - | 54.1 | - | - | - |
| 2026-07-27 07:40 am | N | 6 | 7 | - | - | - | - | 29.85 | - | 59.5 | - | 53.8 | - | - | - |
| 2026-07-27 07:30 am | N | 6 | 7 | - | - | - | - | 29.84 | - | 59.0 | - | 54.5 | - | - | - |
| 2026-07-27 07:20 am | N | 6 | 7 | - | - | - | - | 29.84 | - | 58.8 | - | 55.4 | - | - | - |
| 2026-07-27 07:10 am | N | 6 | 6 | - | - | - | - | 29.84 | - | 59.0 | - | 55.8 | - | - | - |
| 2026-07-27 07:00 am | N | 5 | 6 | - | - | - | - | 29.84 | +0.02 | 59.9 | - | 54.5 | - | - | - |
| 2026-07-27 06:50 am | NNE | 5 | 7 | - | - | - | - | 29.84 | - | 60.1 | - | 54.7 | - | - | - |
| 2026-07-27 06:40 am | N | 5 | 8 | - | - | - | - | 29.84 | - | 59.7 | - | 54.5 | - | - | - |
| 2026-07-27 06:30 am | NNW | 5 | 5 | - | - | - | - | 29.84 | - | 59.4 | - | 54.7 | - | - | - |
| 2026-07-27 06:20 am | N | 5 | 5 | - | - | - | - | 29.84 | - | 59.4 | - | 54.7 | - | - | - |
| 2026-07-27 06:10 am | NNW | 5 | 5 | - | - | - | - | 29.83 | - | 59.2 | - | 54.3 | - | - | - |
| 2026-07-27 06:00 am | N | 5 | 5 | - | - | - | - | 29.83 | +0.01 | 59.4 | - | 54.3 | - | - | - |
| 2026-07-27 05:50 am | N | 5 | 6 | - | - | - | - | 29.83 | - | 58.8 | - | 54.3 | - | - | - |
| 2026-07-27 05:40 am | NNW | 5 | 6 | - | - | - | - | 29.83 | - | 59.4 | - | 53.8 | - | - | - |
| 2026-07-27 05:30 am | N | 5 | 6 | - | - | - | - | 29.83 | - | 59.5 | - | 53.2 | - | - | - |
| 2026-07-27 05:20 am | NNW | 5 | 5 | - | - | - | - | 29.83 | - | 59.4 | - | 53.8 | - | - | - |
| 2026-07-27 05:10 am | NNW | 5 | 5 | - | - | - | - | 29.82 | - | 59.0 | - | 53.8 | - | - | - |
| 2026-07-27 05:00 am | N | 5 | 5 | - | - | - | - | 29.82 | -0.01 | 59.5 | - | 54.1 | - | - | - |
| 2026-07-27 04:50 am | N | 5 | 5 | - | - | - | - | 29.83 | - | 59.7 | - | 54.3 | - | - | - |
Links which are specific to this station are listed below:
Real Time Data in tabular form for the last forty-five days.
Historical Data & Climatic Summaries for quality controlled data for prior months and years.
The weekly status report and the weekly maintenance report also provide valuable station information.
Note that the payload types and the station locations occasionally change.