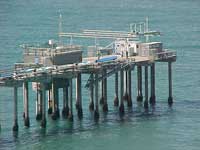
Station LJPC1 - La Jolla, CA (073) 
|
Click on the graph icon in the table below to see a time series plot of the last five days of that observation. | |
| ESE ( 120 deg true ) | |
| 4 kts | |
| 8 kts | |
| 2.3 ft | |
| 9 sec | |
| 7.1 sec | |
| 4 kts | |
| 4 kts | |
|
These wave data are displayed in rounded times. Click on the graph icon in the table below to see a time series plot of the last five days of that observation. | |
| 2.3 ft | |
| 2.3 ft | |
| 4.8 sec | |
| 0.0 ft | |
| 7.1 sec | |
Links which are specific to this station are listed below:
Real Time Data in tabular form for the last forty-five days.
Historical Data & Climatic Summaries for quality controlled data for prior months and years.


