


![]() View the latest observations near Atlantic Tropical Depression Two, East Pacific Tropical Storm Fausto and East Pacific Tropical Storm Elida.
View the latest observations near Atlantic Tropical Depression Two, East Pacific Tropical Storm Fausto and East Pacific Tropical Storm Elida.
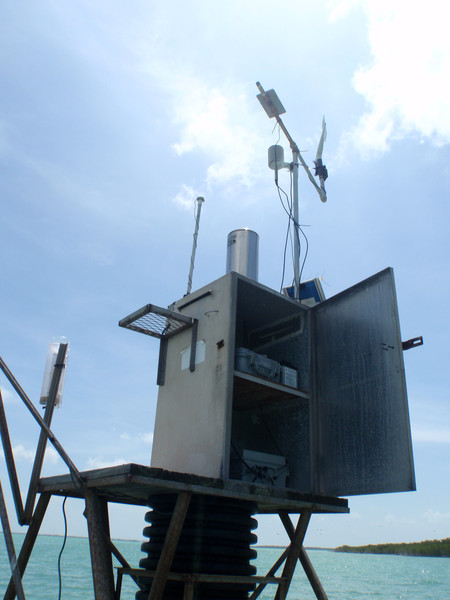
Station BNKF1 - Butternut Key, FL 
Owned and maintained by Everglades National Park
Water Quality Station
25.087 N 80.519 W (25°5'12" N 80°31'8" W)
Site elevation: sea level
Sea temp depth: 1.5 m below MLLW
(24 hours for tsunami stations)
|
Click on the graph icon in the table below to see a time series plot of the last five days of that observation. | |
| 90.1 °F | |
| 38.73 psu | |
| 0.36 ft | |
| TIME (EDT) |
WDIR |
WSPD kts |
GST kts |
WVHT ft |
DPD sec |
APD sec |
MWD |
PRES in |
PTDY in |
ATMP °F |
WTMP °F |
DEWP °F |
SAL psu |
VIS nmi |
TIDE ft |
|---|---|---|---|---|---|---|---|---|---|---|---|---|---|---|---|
| 2026-07-19 04:00 pm | - | - | - | - | - | - | - | - | - | - | 89.8 | - | 38.72 | - | 0.34 |
| 2026-07-19 03:00 pm | - | - | - | - | - | - | - | - | - | - | 89.4 | - | 38.72 | - | 0.29 |
| 2026-07-19 02:00 pm | - | - | - | - | - | - | - | - | - | - | 88.9 | - | 38.74 | - | 0.25 |
| 2026-07-19 01:00 pm | - | - | - | - | - | - | - | - | - | - | 88.3 | - | 38.73 | - | 0.23 |
| 2026-07-19 12:00 pm | - | - | - | - | - | - | - | - | - | - | 87.6 | - | 38.78 | - | 0.20 |
| 2026-07-19 11:00 am | - | - | - | - | - | - | - | - | - | - | 87.3 | - | 38.78 | - | 0.20 |
| 2026-07-19 10:00 am | - | - | - | - | - | - | - | - | - | - | 86.7 | - | 38.78 | - | 0.21 |
| 2026-07-19 09:00 am | - | - | - | - | - | - | - | - | - | - | 86.7 | - | 38.75 | - | 0.23 |
| 2026-07-19 08:00 am | - | - | - | - | - | - | - | - | - | - | 86.7 | - | 38.75 | - | 0.26 |
| 2026-07-19 07:00 am | - | - | - | - | - | - | - | - | - | - | 87.1 | - | 38.69 | - | 0.29 |
| 2026-07-19 06:00 am | - | - | - | - | - | - | - | - | - | - | 87.1 | - | 38.67 | - | 0.28 |
| 2026-07-19 05:00 am | - | - | - | - | - | - | - | - | - | - | 87.4 | - | 38.66 | - | 0.26 |
| 2026-07-19 04:00 am | - | - | - | - | - | - | - | - | - | - | 87.8 | - | 38.62 | - | 0.24 |
| 2026-07-19 03:00 am | - | - | - | - | - | - | - | - | - | - | 88.0 | - | 38.60 | - | 0.20 |
| 2026-07-19 02:00 am | - | - | - | - | - | - | - | - | - | - | 88.2 | - | 38.60 | - | 0.18 |
| 2026-07-19 01:00 am | - | - | - | - | - | - | - | - | - | - | 88.7 | - | 38.57 | - | 0.15 |
| 2026-07-19 12:00 am | - | - | - | - | - | - | - | - | - | - | 89.4 | - | 38.54 | - | 0.15 |
| 2026-07-18 11:00 pm | - | - | - | - | - | - | - | - | - | - | 89.6 | - | 38.51 | - | 0.20 |
|
These oceanographic data are displayed in rounded times. Click on the graph icon in the table below to see a time series plot of the last five days of that observation. | |
| Depth (DEPTH): | 4.9 ft |
| 90.18 °F | |
| 38.73 psu | |
| TIME (EDT) |
DEPTH ft |
OTMP °F |
COND mS/cm |
SAL psu |
O2% % |
O2PPM ppm |
CLCON ug/l |
TURB FTU |
PH |
EH mV |
|---|---|---|---|---|---|---|---|---|---|---|
| 2026-07-19 04:00 pm | 4.9 | 89.80 | - | 38.72 | - | - | - | - | - | - |
| 2026-07-19 03:00 pm | 4.9 | 89.42 | - | 38.72 | - | - | - | - | - | - |
| 2026-07-19 02:00 pm | 4.9 | 88.95 | - | 38.74 | - | - | - | - | - | - |
| 2026-07-19 01:00 pm | 4.9 | 88.36 | - | 38.73 | - | - | - | - | - | - |
| 2026-07-19 12:00 pm | 4.9 | 87.66 | - | 38.78 | - | - | - | - | - | - |
| 2026-07-19 11:00 am | 4.9 | 87.28 | - | 38.78 | - | - | - | - | - | - |
| 2026-07-19 10:00 am | 4.9 | 86.77 | - | 38.78 | - | - | - | - | - | - |
| 2026-07-19 09:00 am | 4.9 | 86.65 | - | 38.75 | - | - | - | - | - | - |
| 2026-07-19 08:00 am | 4.9 | 86.74 | - | 38.75 | - | - | - | - | - | - |
| 2026-07-19 07:00 am | 4.9 | 86.99 | - | 38.69 | - | - | - | - | - | - |
| 2026-07-19 06:00 am | 4.9 | 87.13 | - | 38.67 | - | - | - | - | - | - |
| 2026-07-19 05:00 am | 4.9 | 87.35 | - | 38.66 | - | - | - | - | - | - |
| 2026-07-19 04:00 am | 4.9 | 87.76 | - | 38.62 | - | - | - | - | - | - |
| 2026-07-19 03:00 am | 4.9 | 87.96 | - | 38.60 | - | - | - | - | - | - |
| 2026-07-19 02:00 am | 4.9 | 88.14 | - | 38.60 | - | - | - | - | - | - |
| 2026-07-19 01:00 am | 4.9 | 88.74 | - | 38.57 | - | - | - | - | - | - |
| 2026-07-19 12:00 am | 4.9 | 89.37 | - | 38.54 | - | - | - | - | - | - |
| 2026-07-18 11:00 pm | 4.9 | 89.64 | - | 38.51 | - | - | - | - | - | - |
|
Click on the graph icon in the table below to see a time series plot of the last five days of that observation. |
* indicates interpolated rain values |
| -------- Ten-minute Rain Rates (Centered at hour + minutes) --------- | ||||||||||||||
|---|---|---|---|---|---|---|---|---|---|---|---|---|---|---|
| TIME (EDT) |
Hourly Accum inches |
0 inches/hour | 10 inches/hour | 20 inches/hour | 30 inches/hour | 40 inches/hour | 50 inches/hour | |||||||
| 2026-07-19 05:00 pm | 0.00 | - | - | - | - | - | - | |||||||
| 2026-07-19 04:00 pm | 0.00 | - | - | - | - | - | - | |||||||
| 2026-07-19 03:00 pm | 0.00 | - | - | - | - | - | - | |||||||
| 2026-07-19 02:00 pm | 0.00 | - | - | - | - | - | - | |||||||
| 2026-07-19 01:00 pm | 0.00 | - | - | - | - | - | - | |||||||
| 2026-07-19 12:00 pm | 0.00 | - | - | - | - | - | - | |||||||
| 2026-07-19 11:00 am | 0.00 | - | - | - | - | - | - | |||||||
| 2026-07-19 10:00 am | 0.00 | - | - | - | - | - | - | |||||||
| 2026-07-19 09:00 am | 0.00 | - | - | - | - | - | - | |||||||
| 2026-07-19 08:00 am | 0.00 | - | - | - | - | - | - | |||||||
| 2026-07-19 07:00 am | 0.00 | - | - | - | - | - | - | |||||||
| 2026-07-19 06:00 am | 0.00 | - | - | - | - | - | - | |||||||
| 2026-07-19 05:00 am | 0.00 | - | - | - | - | - | - | |||||||
| 2026-07-19 04:00 am | 0.00 | - | - | - | - | - | - | |||||||
| 2026-07-19 03:00 am | 0.00 | - | - | - | - | - | - | |||||||
| 2026-07-19 02:00 am | 0.00 | - | - | - | - | - | - | |||||||
| 2026-07-19 01:00 am | 0.00 | - | - | - | - | - | - | |||||||
| 2026-07-19 12:00 am | 0.00 | - | - | - | - | - | - | |||||||
| 2026-07-18 11:00 pm | 0.00 | - | - | - | - | - | - | |||||||
Links which are specific to this station are listed below:
Real Time Data in tabular form for the last forty-five days.
Historical data for this station can be requested by directly contacting the Everglades NPS at email: EVER_data_request@nps.gov