


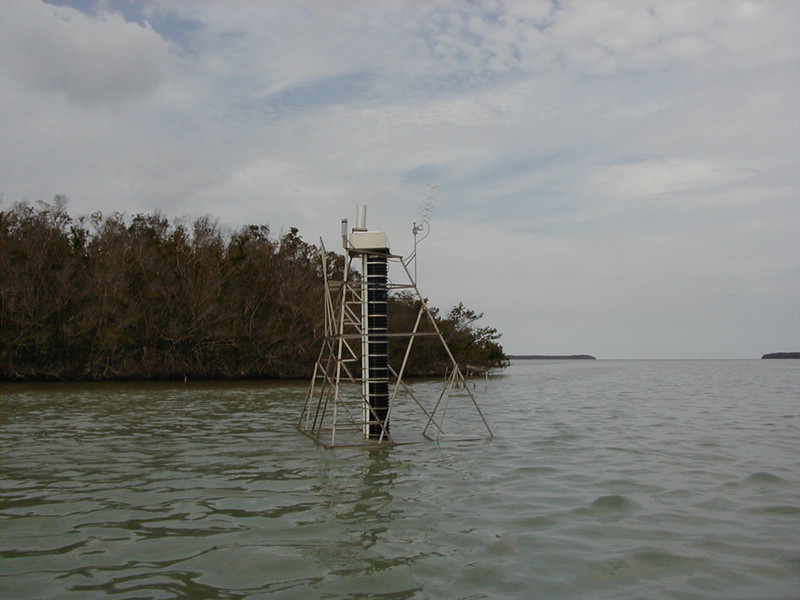
Station MUKF1 - Murray Key, FL 
Owned and maintained by Everglades National Park
Water Quality Station
25.106 N 80.942 W (25°6'22" N 80°56'32" W)
Site elevation: sea level
Sea temp depth: 1.5 m below MLLW
Water levels are referenced to local datums. They provide relative change in water level and are not to be used for navigation.
Large icon indicates selected station.
 Stations with recent data
 Stations with no data in last 8 hours
(24 hours for tsunami stations)
(24 hours for tsunami stations)
|
Click on the graph icon in the table below to see a time series plot of the last five days of that observation. | |
| 94.8 °F | |
| 39.27 psu | |
| TIME (EDT) |
WDIR |
WSPD kts |
GST kts |
WVHT ft |
DPD sec |
APD sec |
MWD |
PRES in |
PTDY in |
ATMP °F |
WTMP °F |
DEWP °F |
SAL psu |
VIS nmi |
TIDE ft |
|---|---|---|---|---|---|---|---|---|---|---|---|---|---|---|---|
| 2026-07-06 03:00 pm | - | - | - | - | - | - | - | - | - | - | 95.0 | - | 39.27 | - | - |
| 2026-07-06 02:00 pm | - | - | - | - | - | - | - | - | - | - | 93.2 | - | 38.45 | - | - |
| 2026-07-06 01:00 pm | - | - | - | - | - | - | - | - | - | - | 92.1 | - | 38.45 | - | - |
| 2026-07-06 12:00 pm | - | - | - | - | - | - | - | - | - | - | 89.8 | - | 38.75 | - | - |
| 2026-07-06 11:00 am | - | - | - | - | - | - | - | - | - | - | 88.5 | - | 39.87 | - | - |
| 2026-07-06 10:00 am | - | - | - | - | - | - | - | - | - | - | 87.8 | - | 40.18 | - | - |
| 2026-07-06 09:00 am | - | - | - | - | - | - | - | - | - | - | 88.0 | - | 39.35 | - | - |
| 2026-07-06 08:00 am | - | - | - | - | - | - | - | - | - | - | 87.8 | - | 39.27 | - | - |
| 2026-07-06 07:00 am | - | - | - | - | - | - | - | - | - | - | 88.2 | - | 40.78 | - | - |
| 2026-07-06 06:00 am | - | - | - | - | - | - | - | - | - | - | 87.8 | - | 39.80 | - | - |
| 2026-07-06 05:00 am | - | - | - | - | - | - | - | - | - | - | 86.0 | - | 39.50 | - | - |
| 2026-07-06 04:00 am | - | - | - | - | - | - | - | - | - | - | 86.5 | - | 39.42 | - | - |
| 2026-07-06 03:00 am | - | - | - | - | - | - | - | - | - | - | 86.0 | - | 39.05 | - | - |
| 2026-07-06 02:00 am | - | - | - | - | - | - | - | - | - | - | 86.9 | - | 39.27 | - | - |
| 2026-07-06 01:00 am | - | - | - | - | - | - | - | - | - | - | 87.1 | - | 39.35 | - | - |
| 2026-07-06 12:00 am | - | - | - | - | - | - | - | - | - | - | 87.8 | - | 39.72 | - | - |
| 2026-07-05 11:00 pm | - | - | - | - | - | - | - | - | - | - | 88.5 | - | 39.95 | - | - |
| 2026-07-05 05:00 pm | - | - | - | - | - | - | - | - | - | - | 91.2 | - | 40.93 | - | - |
|
These oceanographic data are displayed in rounded times. Click on the graph icon in the table below to see a time series plot of the last five days of that observation. | |
| Depth (DEPTH): | 4.9 ft |
| 94.89 °F | |
| 39.27 psu | |
| TIME (EDT) |
DEPTH ft |
OTMP °F |
COND mS/cm |
SAL psu |
O2% % |
O2PPM ppm |
CLCON ug/l |
TURB FTU |
PH |
EH mV |
|---|---|---|---|---|---|---|---|---|---|---|
| 2026-07-06 03:00 pm | 4.9 | 95.05 | - | 39.27 | - | - | - | - | - | - |
| 2026-07-06 02:00 pm | 4.9 | 93.24 | - | 38.45 | - | - | - | - | - | - |
| 2026-07-06 01:00 pm | 4.9 | 92.10 | - | 38.45 | - | - | - | - | - | - |
| 2026-07-06 12:00 pm | 4.9 | 89.76 | - | 38.75 | - | - | - | - | - | - |
| 2026-07-06 11:00 am | 4.9 | 88.48 | - | 39.87 | - | - | - | - | - | - |
| 2026-07-06 10:00 am | 4.9 | 87.87 | - | 40.18 | - | - | - | - | - | - |
| 2026-07-06 09:00 am | 4.9 | 87.89 | - | 39.35 | - | - | - | - | - | - |
| 2026-07-06 08:00 am | 4.9 | 87.76 | - | 39.27 | - | - | - | - | - | - |
| 2026-07-06 07:00 am | 4.9 | 88.21 | - | 40.78 | - | - | - | - | - | - |
| 2026-07-06 06:00 am | 4.9 | 87.85 | - | 39.80 | - | - | - | - | - | - |
| 2026-07-06 05:00 am | 4.9 | 85.96 | - | 39.50 | - | - | - | - | - | - |
| 2026-07-06 04:00 am | 4.9 | 86.45 | - | 39.42 | - | - | - | - | - | - |
| 2026-07-06 03:00 am | 4.9 | 86.05 | - | 39.05 | - | - | - | - | - | - |
| 2026-07-06 02:00 am | 4.9 | 86.88 | - | 39.27 | - | - | - | - | - | - |
| 2026-07-06 01:00 am | 4.9 | 87.15 | - | 39.35 | - | - | - | - | - | - |
| 2026-07-06 12:00 am | 4.9 | 87.71 | - | 39.72 | - | - | - | - | - | - |
| 2026-07-05 11:00 pm | 4.9 | 88.45 | - | 39.95 | - | - | - | - | - | - |
| 2026-07-05 05:00 pm | 4.9 | 91.29 | - | 40.93 | - | - | - | - | - | - |
Links which are specific to this station are listed below:
Real Time Data in tabular form for the last forty-five days.
Historical data for this station can be requested by directly contacting the Everglades NPS at email: EVER_data_request@nps.gov