


![]() View the latest observations near Central Pacific Hurricane Fausto and East Pacific Hurricane Genevieve.
View the latest observations near Central Pacific Hurricane Fausto and East Pacific Hurricane Genevieve.
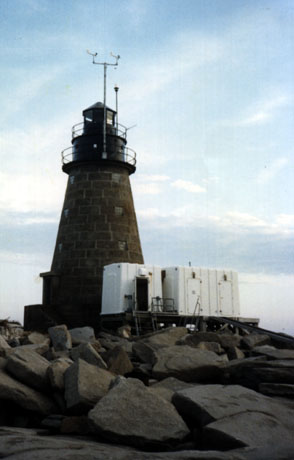
Station MDRM1 - Mt. Desert Rock, ME 
Owned and maintained by National Data Buoy Center
C-MAN Station
MARS payload
43.969 N 68.128 W (43°58'7" N 68°7'42" W)
Site elevation: 9.1 m above mean sea level
Air temp height: 15.2 m above site elevation
Anemometer height: 22.6 m above site elevation
Barometer elevation: 16.5 m above mean sea level
Meteorological Observations from Nearby Stations and Ships
![]()
(24 hours for tsunami stations)
|
Click on the graph icon in the table below to see a time series plot of the last five days of that observation. | |
| NE ( 50 deg true ) | |
| 8 kts | |
| 9 kts | |
| 29.90 in | |
| -0.06 in ( Falling ) | |
| 58.5 °F | |
| 8 kts | |
| 8 kts | |
|
|||||||||||||||||||||||
|
| TIME (EDT) |
WDIR |
WSPD kts |
GST kts |
WVHT ft |
DPD sec |
APD sec |
MWD |
PRES in |
PTDY in |
ATMP °F |
WTMP °F |
DEWP °F |
SAL psu |
VIS nmi |
TIDE ft |
|---|---|---|---|---|---|---|---|---|---|---|---|---|---|---|---|
| 2026-07-26 02:00 pm | ENE | 11 | 11 | - | - | - | - | 29.91 | -0.05 | 56.8 | - | - | - | - | - |
| 2026-07-26 01:00 pm | NE | 9 | 10 | - | - | - | - | 29.94 | -0.04 | 55.6 | - | - | - | - | - |
| 2026-07-26 12:00 pm | NNE | 7 | 8 | - | - | - | - | 29.96 | -0.01 | 55.4 | - | - | - | - | - |
| 2026-07-26 11:00 am | NNE | 10 | 11 | - | - | - | - | 29.96 | -0.02 | 54.3 | - | - | - | - | - |
| 2026-07-26 10:00 am | NNE | 9 | 9 | - | - | - | - | 29.97 | -0.01 | 52.9 | - | - | - | - | - |
| 2026-07-26 09:00 am | NNE | 10 | 11 | - | - | - | - | 29.97 | -0.01 | 52.3 | - | - | - | - | - |
| 2026-07-26 08:00 am | NNE | 10 | 11 | - | - | - | - | 29.98 | +0.02 | 52.5 | - | - | - | - | - |
| 2026-07-26 07:00 am | N | 9 | 10 | - | - | - | - | 29.98 | +0.01 | 54.3 | - | - | - | - | - |
| 2026-07-26 06:00 am | N | 7 | 7 | - | - | - | - | 29.98 | +0.00 | 55.9 | - | - | - | - | - |
| 2026-07-26 05:00 am | NE | 10 | 10 | - | - | - | - | 29.96 | -0.04 | 57.0 | - | - | - | - | - |
| 2026-07-26 04:00 am | ENE | 10 | 10 | - | - | - | - | 29.97 | -0.05 | 56.7 | - | - | - | - | - |
| 2026-07-26 03:00 am | ENE | 8 | 8 | - | - | - | - | 29.99 | -0.04 | 57.9 | - | - | - | - | - |
| 2026-07-26 02:00 am | ENE | 8 | 8 | - | - | - | - | 30.00 | -0.04 | 58.6 | - | - | - | - | - |
| 2026-07-26 01:00 am | NE | 3 | 3 | - | - | - | - | 30.02 | -0.03 | 57.4 | - | - | - | - | - |
| 2026-07-26 12:00 am | - | 0 | 0 | - | - | - | - | 30.03 | -0.02 | 61.3 | - | - | - | - | - |
| 2026-07-25 11:00 pm | - | 0 | 1 | - | - | - | - | 30.04 | -0.01 | 61.7 | - | - | - | - | - |
| 2026-07-25 10:00 pm | - | 0 | 1 | - | - | - | - | 30.05 | -0.02 | 62.8 | - | - | - | - | - |
| 2026-07-25 09:00 pm | SE | 6 | 6 | - | - | - | - | 30.06 | -0.02 | 62.6 | - | - | - | - | - |
| 2026-07-25 08:00 pm | S | 5 | 6 | - | - | - | - | 30.06 | -0.03 | 65.3 | - | - | - | - | - |
| 2026-07-25 07:00 pm | S | 7 | 8 | - | - | - | - | 30.07 | -0.04 | 66.7 | - | - | - | - | - |
| 2026-07-25 06:00 pm | S | 5 | 5 | - | - | - | - | 30.07 | -0.04 | 71.4 | - | - | - | - | - |
| 2026-07-25 05:00 pm | SE | 7 | 7 | - | - | - | - | 30.09 | -0.05 | 67.8 | - | - | - | - | - |
| 2026-07-25 04:00 pm | S | 7 | 7 | - | - | - | - | 30.11 | -0.04 | 66.6 | - | - | - | - | - |
| 2026-07-25 03:00 pm | S | 5 | 6 | - | - | - | - | 30.12 | -0.05 | 66.7 | - | - | - | - | - |
Links which are specific to this station are listed below:
Real Time Data in tabular form for the last forty-five days.
Historical Data & Climatic Summaries for quality controlled data for prior months and years.
The weekly status report and the weekly maintenance report also provide valuable station information.
Note that the payload types and the station locations occasionally change.