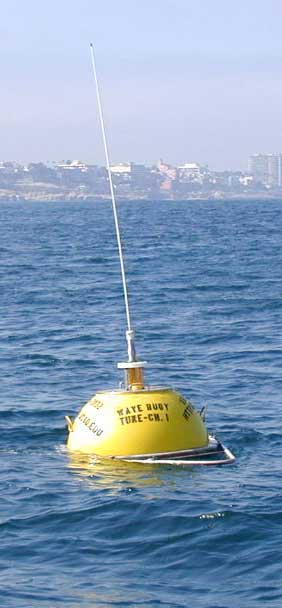
Station 46235 - Imperial Beach Nearshore, CA (155) Image indicating link to RSS feed of recent meteorological observations for station 46235


Conditions at 46235 as of
(6:00 am PST)
1400 GMT on 02/14/2025:
     

Click on the graph icon in the table below to see a time series plot of the last five days of that observation.

5-day plot - Wave Height Wave Height (WVHT): 4.9 ft
5-day plot - Dominant Wave Period Dominant Wave Period (DPD): 9 sec
5-day plot - Average Wave Period Average Period (APD): 6.9 sec
5-day plot - Mean Wave Direction Mean Wave Direction (MWD): W ( 276 deg true )
5-day plot - Air Temperature Air Temperature (ATMP): 56.5 °F
5-day plot - Water Temperature Water Temperature (WTMP): 55.8 °F
Previous observations
TIME
(PST)
5-day plot - Wind Direction
WDIR
 
5-day plot - Wind Speed
WSPD
kts
5-day plot - Wind Gust
GST
kts
5-day plot - Wave Height
WVHT
ft
5-day plot - Dominant Wave Period
DPD
sec
5-day plot - Average Wave Period
APD
sec
5-day plot - Mean Wave Direction
MWD
 
5-day plot - Atmospheric Pressure
PRES
in
5-day plot - Pressure Tendency
PTDY
in
5-day plot - Air Temperature
ATMP
°F
5-day plot - Water Temperature
WTMP
°F
5-day plot - Dew Point
DEWP
°F
5-day plot - Salinity
SAL
psu
5-day plot - Visibility
VIS
nmi
5-day plot - Tide (above MLLW)
TIDE
ft
2025-02-14 05:30 am--- 4.6 106.8 W-- 56.7 55.8----
2025-02-14 05:00 am--- 4.6 106.5 W-- 56.7 55.8----
2025-02-14 04:30 am--- 4.3 146.2 W-- 56.7 55.8----
2025-02-14 04:00 am--- 4.6 106.1WNW-- 56.7 55.8----
2025-02-14 03:30 am--- 4.3 75.8 W-- 56.5 55.8----
2025-02-14 03:00 am--- 4.6 55.6WSW--- 55.8----
2025-02-14 02:30 am--- 4.6 55.3 SW--- 55.8----
2025-02-14 02:00 am--- 4.6 155.1 W--- 55.8----
2025-02-14 01:30 am--- 4.6 54.8 SW-- 56.5 55.9----
2025-02-14 01:00 am--- 4.9 54.7WSW-- 56.7 55.9----
2025-02-14 12:30 am--- 4.9 44.7SSW-- 57.2 55.8----
2025-02-14 12:00 am--- 5.2 54.7SSW-- 56.7 55.8----
2025-02-13 11:30 pm--- 5.2 54.6SSW-- 56.7 55.8----
2025-02-13 11:00 pm--- 4.9 54.4SSW-- 56.7 55.8----
2025-02-13 10:30 pm--- 4.9 54.6SSW-- 56.7 55.8----
2025-02-13 10:00 pm--- 4.9 154.5 W-- 56.7 55.8----
2025-02-13 09:30 pm--- 4.9 44.4SSW-- 56.7 55.8----
2025-02-13 09:00 pm--- 4.6 44.4SSW-- 56.7 55.8----
2025-02-13 08:30 pm--- 4.6 144.8 W-- 56.5 55.8----
2025-02-13 08:00 pm--- 4.3 154.5 W-- 56.5 55.8----
2025-02-13 07:30 pm--- 4.6 44.5 S-- 56.3 55.9----
2025-02-13 07:00 pm--- 4.3 84.5 W-- 56.5 56.1----
2025-02-13 06:30 pm--- 4.3 144.5 W-- 56.5 56.1----
2025-02-13 06:00 pm--- 4.3 74.6 W-- 56.8 56.1----
2025-02-13 05:30 pm--- 4.3 75.0 W-- 56.5 56.3----
2025-02-13 05:00 pm--- 3.9 84.8 W-- 56.5 56.3----
2025-02-13 04:30 pm--- 3.9 95.0 W--- 56.3----
2025-02-13 04:00 pm--- 3.9 85.1 W-- 56.7 56.5----
2025-02-13 03:30 pm--- 4.3 85.4 W-- 56.7 56.3----
2025-02-13 03:00 pm--- 3.9 85.1 W-- 56.8 56.5----
2025-02-13 02:30 pm--- 3.9 155.0 W-- 56.7 56.5----
2025-02-13 02:00 pm--- 3.9 85.3 W-- 56.8 56.5----
2025-02-13 01:30 pm--- 3.9 155.2 W-- 56.8 56.1----
2025-02-13 01:00 pm--- 3.9 85.1 W-- 57.0 56.1----
2025-02-13 12:30 pm--- 3.9 75.2 W-- 56.7 56.1----
2025-02-13 12:00 pm--- 3.9 115.0 W-- 56.8 56.1----
2025-02-13 11:30 am--- 3.9 85.3 W-- 56.8 56.3----
2025-02-13 11:00 am--- 3.9 135.0 W-- 56.8 55.9----
2025-02-13 10:30 am--- 3.9 85.0 W-- 56.3 55.8----
2025-02-13 10:00 am--- 3.9 85.2 W-- 55.9 55.4----
2025-02-13 09:30 am--- 3.9 75.2 W-- 55.8 55.4----
2025-02-13 09:00 am--- 3.9 85.2 W-- 55.6 55.4----
2025-02-13 08:30 am--- 3.9 75.0 W-- 55.4 55.2----
2025-02-13 08:00 am--- 3.9 75.2 W-- 55.2 55.2----
2025-02-13 07:30 am--- 3.9 75.0 W-- 55.4 55.2----
2025-02-13 07:00 am--- 3.9 155.1 W--- 55.2----
2025-02-13 06:30 am--- 4.3 85.0 W-- 55.2 55.2----
2025-02-13 06:00 am--- 4.3 75.0 W-- 55.0 55.2----

Detailed Wave Summary
for 46235 as of (6:00 am PST)
1400 GMT on 02/14/2025:

These wave data are displayed in rounded times.


Click on the graph icon in the table below to see a time series plot of the last five days of that observation.

5-day plot - Significant Wave Height Significant Wave Height (WVHT): 4.6 ft
5-day plot - Swell Height Swell Height (SwH): 2.3 ft
5-day plot - Swell Period Swell Period (SwP): 13.3 sec
5-day plot - Swell Direction Swell Direction (SwD): W
5-day plot - Wind Wave Height Wind Wave Height (WWH): 3.9 ft
5-day plot - Wind Wave Period Wind Wave Period (WWP): 9.1 sec
5-day plot - Wind Wave Direction Wind Wave Direction (WWD): W
5-day plot - Wave Steepness Wave Steepness (STEEPNESS): AVERAGE
5-day plot - Average Wave Period Average Wave Period (APD): 6.9 sec
Previous observations
TIME
(PST)
5-day plot - Wave Height
WVHT
ft
5-day plot - Swell Height
SwH
ft
5-day plot - Swell Period
SwP
sec
5-day plot - Swell Direction
SwD
 
5-day plot - Wind Wave Height
WWH
ft
5-day plot - Wind Wave Period
WWP
sec
5-day plot - Wind Wave Direction
WWD
 
5-day plot - Wave Steepness
STEEPNESS
 
5-day plot - Average Wave Period
APD
sec
2025-02-14 05:30 am 4.6 2.3 10.0 W 3.9 9.5 W AVERAGE 6.8
2025-02-14 05:00 am 4.6 2.6 13.3 W 3.9 9.5 W AVERAGE 6.5
2025-02-14 04:30 am 4.3 2.3 14.3 W 3.6 9.5 W AVERAGE 6.2
2025-02-14 04:00 am 4.6 2.0 10.0 W 3.9 9.5 WNW AVERAGE 6.1
2025-02-14 03:30 am 4.3 2.0 10.0 W 3.9 6.9 W STEEP 5.8
2025-02-14 03:00 am 4.6 2.0 14.3 W 4.3 5.4 WSWVERY_STEEP 5.6
2025-02-14 02:30 am 4.6 2.0 10.0 W 4.3 5.0 SWVERY_STEEP 5.3
2025-02-14 02:00 am 4.6 2.0 15.4 W 3.9 5.9 WSW AVERAGE 5.1
2025-02-14 01:30 am 4.6 1.6 15.4 W 4.3 4.8 SWVERY_STEEP 4.8
2025-02-14 01:00 am 4.9 1.6 14.3 W 4.6 5.0 WSWVERY_STEEP 4.7
2025-02-14 12:30 am 4.9 2.0 15.4 W 4.6 4.4 SSWVERY_STEEP 4.7
2025-02-14 12:00 am 5.2 2.0 15.4 W 4.9 4.5 SSWVERY_STEEP 4.7
2025-02-13 11:30 pm 5.2 2.0 15.4 W 4.6 4.7 SSWVERY_STEEP 4.6
2025-02-13 11:00 pm 4.9 1.6 14.3 W 4.6 4.5 SSWVERY_STEEP 4.4
2025-02-13 10:30 pm 4.9 2.3 14.3 W 4.6 4.5 SSWVERY_STEEP 4.6
2025-02-13 10:00 pm 4.9 2.0 15.4 W 4.6 4.3 SSW AVERAGE 4.5
2025-02-13 09:30 pm 4.6 2.0 14.3 W 4.3 4.0 SSWVERY_STEEP 4.4
2025-02-13 09:00 pm 4.6 2.0 14.3 W 4.3 4.1 SSWVERY_STEEP 4.4
2025-02-13 08:30 pm 4.6 2.3 14.3 W 3.9 8.7 W AVERAGE 4.8
2025-02-13 08:00 pm 4.3 2.0 15.4 W 3.9 4.1 SSW AVERAGE 4.5
2025-02-13 07:30 pm 4.6 1.6 15.4 W 4.3 4.2 SVERY_STEEP 4.5
2025-02-13 07:00 pm 4.3 1.6 14.3WNW 3.9 8.0 W AVERAGE 4.5
2025-02-13 06:30 pm 4.3 2.0 14.3 W 3.9 7.1 W AVERAGE 4.5
2025-02-13 06:00 pm 4.3 1.6 10.0 W 3.9 7.4 W AVERAGE 4.6
2025-02-13 05:30 pm 4.3 2.0 14.3 W 3.6 7.4 W AVERAGE 5.0
2025-02-13 05:00 pm 3.9 1.6 15.4 W 3.6 8.0 W AVERAGE 4.8
2025-02-13 04:30 pm 3.9 1.6 12.5 W 3.6 9.1 W AVERAGE 5.0
2025-02-13 04:00 pm 3.9 1.6 14.3 W 3.3 8.3 W AVERAGE 5.1
2025-02-13 03:30 pm 3.9 2.0 15.4 W 3.6 8.3 W AVERAGE 5.4
2025-02-13 03:00 pm 3.9 1.6 10.5 W 3.6 8.3 W AVERAGE 5.1
2025-02-13 02:30 pm 3.9 2.0 15.4 W 3.3 8.3 W AVERAGE 5.0
2025-02-13 02:00 pm 3.9 2.0 15.4 W 3.6 8.3 W AVERAGE 5.3
2025-02-13 01:30 pm 3.9 2.0 15.4 W 3.3 8.3 W AVERAGE 5.2
2025-02-13 01:00 pm 3.9 1.6 15.4 W 3.3 8.0 W AVERAGE 5.1
2025-02-13 12:30 pm 3.9 2.0 15.4 W 3.6 7.7 W AVERAGE 5.2
2025-02-13 12:00 pm 3.6 1.6 11.1 W 3.3 7.7 W AVERAGE 5.0
2025-02-13 11:30 am 3.9 1.6 12.5 W 3.3 8.0 W AVERAGE 5.3
2025-02-13 11:00 am 3.9 1.6 12.5 W 3.3 7.7 W AVERAGE 5.0
2025-02-13 10:30 am 3.9 1.6 12.5 W 3.6 8.3 W AVERAGE 5.0
2025-02-13 10:00 am 3.9 1.6 11.8 W 3.6 8.0 W AVERAGE 5.2
2025-02-13 09:30 am 3.9 1.6 15.4 W 3.6 6.9 W STEEP 5.2
2025-02-13 09:00 am 3.9 1.6 11.8 W 3.6 8.0 W AVERAGE 5.2
2025-02-13 08:30 am 3.9 1.6 12.5 W 3.6 7.4 W AVERAGE 5.0
2025-02-13 08:00 am 3.9 2.0 13.3 W 3.6 7.4 W AVERAGE 5.2
2025-02-13 07:30 am 3.9 1.6 13.3 W 3.6 7.1 W AVERAGE 5.0
2025-02-13 07:00 am 3.9 2.0 15.4 W 3.6 7.7 W AVERAGE 5.1
2025-02-13 06:30 am 4.3 1.6 12.5 W 3.9 8.0 W AVERAGE 5.0
2025-02-13 06:00 am 4.3 1.6 16.7 W 3.9 7.4 W AVERAGE 5.0

Plot of wave energy versus frequency (and period)


Disclaimer: Ocean current directions are reported to the nearest 10 degrees and speeds are measured to the nearest whole centimeter per second.

Ocean Current Data for 46235

Unit of Measure:   Time Zone:   
6:00 am PST 4:00 am PST 3:30 am PST 3:00 am PST
Depth
ft
Dir
°
Speed
kts
Dir
°
Speed
kts
Dir
°
Speed
kts
Dir
°
Speed
kts
3 350 0.37350 0.37350 0.35350 0.35

Previous (up to 48) reports of ocean current data for 46235

Ocean Current Stick Plots are available in metric units only:

All Instruments - 1-day plot - ocean current 1-day plot     3-day plot - ocean current 3-day plot     5-day plot - ocean current 5-day plot