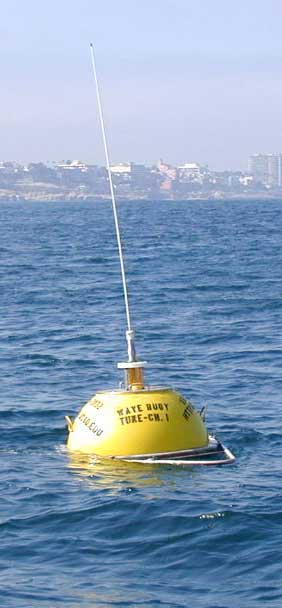
Station 46229 - UMPQUA OFFSHORE, OR (139) Image indicating link to RSS feed of recent meteorological observations for station 46229


Conditions at 46229 as of
(8:30 pm PST on 02/04/2026)
0430 GMT on 02/05/2026:
     

Click on the graph icon in the table below to see a time series plot of the last five days of that observation.

5-day plot - Wave Height Wave Height (WVHT): 10.5 ft
5-day plot - Dominant Wave Period Dominant Wave Period (DPD): 13 sec
5-day plot - Average Wave Period Average Period (APD):10.4 sec
5-day plot - Mean Wave Direction Mean Wave Direction (MWD):WSW ( 250 deg true )
5-day plot - Air Temperature Air Temperature (ATMP): 53.8 °F
5-day plot - Water Temperature Water Temperature (WTMP): 53.1 °F
Previous observations
TIME
(PST)
5-day plot - Wind Direction
WDIR
 
5-day plot - Wind Speed
WSPD
kts
5-day plot - Wind Gust
GST
kts
5-day plot - Wave Height
WVHT
ft
5-day plot - Dominant Wave Period
DPD
sec
5-day plot - Average Wave Period
APD
sec
5-day plot - Mean Wave Direction
MWD
 
5-day plot - Atmospheric Pressure
PRES
in
5-day plot - Pressure Tendency
PTDY
in
5-day plot - Air Temperature
ATMP
°F
5-day plot - Water Temperature
WTMP
°F
5-day plot - Dew Point
DEWP
°F
5-day plot - Salinity
SAL
psu
5-day plot - Visibility
VIS
nmi
5-day plot - Tide (above MLLW)
TIDE
ft
2026-02-04 08:00 pm--- 11.2 1311.0WSW-- 53.6 53.2----
2026-02-04 07:30 pm--- 11.5 1310.8WSW-- 54.0 53.1----
2026-02-04 07:00 pm--- 11.8 1210.8WSW-- 53.8 53.1----
2026-02-04 06:30 pm--- 10.8 1310.6WSW-- 53.2 53.1----
2026-02-04 06:00 pm--- 11.2 1310.9WSW-- 53.2 53.2----
2026-02-04 05:30 pm--- 10.8 1310.8WSW-- 53.2 53.4----
2026-02-04 05:00 pm--- 10.5 1310.8WSW-- 53.6 53.6----
2026-02-04 04:30 pm--- 10.8 1311.1WSW-- 54.5 54.3----
2026-02-04 04:00 pm--- 12.1 1311.1WSW-- 55.0 54.3----
2026-02-04 03:30 pm--- 10.8 1311.0WSW--- 54.5----
2026-02-04 03:00 pm--- 11.5 1411.2 W--- 54.5----
2026-02-04 02:30 pm--- 11.5 1110.9WSW-- 54.3 54.3----
2026-02-04 02:00 pm--- 10.2 1310.8WSW-- 54.1 54.0----
2026-02-04 01:30 pm--- 11.5 1311.0WSW-- 53.8 53.6----
2026-02-04 01:00 pm--- 12.5 1311.4WSW-- 53.4 53.4----
2026-02-04 12:30 pm--- 11.8 1311.1WSW-- 53.1 53.2----
2026-02-04 12:00 pm--- 10.8 1310.8WSW-- 53.1 53.1----
2026-02-04 11:30 am--- 10.8 1511.1 W-- 53.1 53.1----
2026-02-04 11:00 am--- 10.8 1310.7WSW-- 53.1 52.9----
2026-02-04 10:30 am--- 9.8 1110.6WSW-- 53.1 52.7----
2026-02-04 10:00 am--- 11.2 1511.6 W-- 52.9 52.7----
2026-02-04 09:30 am--- 9.5 1310.9WSW-- 53.1 52.7----
2026-02-04 09:00 am--- 10.5 1511.2 W-- 52.7 52.7----
2026-02-04 08:30 am--- 9.2 1310.6WSW-- 52.3 52.7----
2026-02-04 08:00 am--- 9.2 1710.7WNW-- 51.8 52.7----
2026-02-04 07:30 am--- 9.2 1310.9WSW-- 51.4 52.7----
2026-02-04 07:00 am--- 8.9 1710.6WNW-- 51.6 52.5----
2026-02-04 06:30 am--- 8.5 1110.2WSW-- 51.6 52.7----
2026-02-04 06:00 am--- 8.5 1110.6WSW-- 51.8 52.7----
2026-02-04 05:30 am--- 9.2 1711.5WNW-- 52.0 52.7----
2026-02-04 05:00 am--- 7.5 1110.2 W-- 52.3 52.7----
2026-02-04 04:30 am--- 8.2 1710.8 W-- 52.2 52.7----
2026-02-04 04:00 am--- 8.5 1210.6 W-- 52.2 52.7----
2026-02-04 03:30 am--- 7.5 1110.3WSW-- 52.3 52.9----
2026-02-04 03:00 am--- 8.5 1711.0WNW-- 52.3 52.9----
2026-02-04 02:30 am--- 7.5 1310.4 W-- 52.5 52.9----
2026-02-04 02:00 am--- 7.9 1210.3WSW-- 52.5 52.9----
2026-02-04 01:30 am--- 7.5 1110.0 W-- 52.2 52.9----
2026-02-04 01:00 am--- 7.5 1810.6WNW-- 52.2 52.9----
2026-02-04 12:30 am--- 7.2 1110.4 W-- 52.5 52.9----
2026-02-04 12:00 am--- 7.5 1810.6WNW-- 52.5 52.9----
2026-02-03 11:30 pm--- 6.2 1110.1 W-- 53.1 52.9----
2026-02-03 11:00 pm--- 6.6 1810.3WNW-- 53.1 52.9----
2026-02-03 10:30 pm--- 5.9 189.6 W-- 52.9 52.9----
2026-02-03 10:00 pm--- 6.2 119.8 W-- 52.9 52.9----
2026-02-03 09:30 pm--- 5.9 189.7 W-- 53.1 52.9----
2026-02-03 09:00 pm--- 5.9 189.6 W-- 53.1 52.9----

Wave Summary
for 46229 as of
(8:30 pm PST on 02/04/2026)
0430 GMT on 02/05/2026:

These wave data are displayed in rounded times.


Click on the graph icon in the table below to see a time series plot of the last five days of that observation.

5-day plot - Significant Wave Height Significant Wave Height (WVHT): 10.5 ft
5-day plot - Swell Height Swell Height (SwH): 8.9 ft
5-day plot - Swell Period Swell Period (SwP): 13.3 sec
5-day plot - Swell Direction Swell Direction (SwD):WSW
5-day plot - Wind Wave Height Wind Wave Height (WWH): 5.6 ft
5-day plot - Wind Wave Period Wind Wave Period (WWP): 9.5 sec
5-day plot - Wind Wave Direction Wind Wave Direction (WWD):WSW
5-day plot - Wave Steepness Wave Steepness (STEEPNESS): SWELL
5-day plot - Average Wave Period Average Wave Period (APD): 10.4 sec
Previous observations
TIME
(PST)
5-day plot - Wave Height
WVHT
ft
5-day plot - Swell Height
SwH
ft
5-day plot - Swell Period
SwP
sec
5-day plot - Swell Direction
SwD
 
5-day plot - Wind Wave Height
WWH
ft
5-day plot - Wind Wave Period
WWP
sec
5-day plot - Wind Wave Direction
WWD
 
5-day plot - Wave Steepness
STEEPNESS
 
5-day plot - Average Wave Period
APD
sec
2026-02-04 08:00 pm 11.2 9.8 12.5WSW 4.9 9.5 WSW SWELL 11.0
2026-02-04 07:30 pm 11.5 10.2 13.3WSW 5.2 9.1 WSW SWELL 10.8
2026-02-04 07:00 pm 11.8 10.5 11.8WSW 5.2 9.5 WSW AVERAGE 10.8
2026-02-04 06:30 pm 10.8 9.5 12.5WSW 5.2 9.5 WSW SWELL 10.6
2026-02-04 06:00 pm 11.2 9.8 12.5WSW 5.2 9.5 WSW SWELL 10.9
2026-02-04 05:30 pm 10.8 9.5 13.3WSW 5.2 9.5 WSW SWELL 10.8
2026-02-04 05:00 pm 10.5 9.5 12.5WSW 4.9 9.5 WSW SWELL 10.8
2026-02-04 04:30 pm 10.8 9.5 13.3WSW 4.9 9.5 WSW SWELL 11.1
2026-02-04 04:00 pm 12.1 11.2 12.5WSW 4.9 9.5 WSW SWELL 11.1
2026-02-04 03:30 pm 10.8 9.5 13.3WSW 5.2 9.5 WSW SWELL 11.0
2026-02-04 03:00 pm 11.5 10.5 14.3 W 4.9 9.5 WSW SWELL 11.2
2026-02-04 02:30 pm 11.5 10.2 11.1WSW 5.2 9.5 WSW AVERAGE 10.9
2026-02-04 02:00 pm 10.2 8.9 13.3WSW 4.9 9.5 WSW SWELL 10.8
2026-02-04 01:30 pm 11.5 10.2 13.3WSW 4.6 9.5 WSW SWELL 11.0
2026-02-04 01:00 pm 12.5 11.5 12.5WSW 4.6 9.5 WSW SWELL 11.4
2026-02-04 12:30 pm 11.8 10.5 12.5WSW 4.9 9.5 WSW SWELL 11.1
2026-02-04 12:00 pm 10.5 9.5 13.3WSW 4.9 9.5 WSW SWELL 10.8
2026-02-04 11:30 am 10.8 9.5 15.4 W 4.9 9.5 WSW SWELL 11.1
2026-02-04 11:00 am 10.8 9.5 12.5WSW 5.6 9.5 WSW SWELL 10.7
2026-02-04 10:30 am 9.8 8.2 11.1WSW 4.9 9.5 WSW AVERAGE 10.6
2026-02-04 10:00 am 11.2 10.2 15.4 W 4.9 9.5 WSW SWELL 11.6
2026-02-04 09:30 am 9.5 8.2 12.5WSW 4.6 9.5 WSW SWELL 10.9
2026-02-04 09:00 am 10.5 9.2 15.4 W 4.6 9.1 WSW SWELL 11.2
2026-02-04 08:30 am 9.2 7.9 12.5WSW 4.6 9.5 WSW SWELL 10.6
2026-02-04 08:00 am 9.2 7.9 16.7WNW 4.9 9.5 WSW SWELL 10.7
2026-02-04 07:30 am 9.2 7.9 13.3WSW 4.9 9.5 WSW SWELL 10.9
2026-02-04 07:00 am 8.9 7.2 16.7WNW 4.9 9.5 WSW SWELL 10.6
2026-02-04 06:30 am 8.5 6.6 10.5WSW 4.9 9.5 WSW AVERAGE 10.2
2026-02-04 06:00 am 8.5 7.2 11.1WSW 4.3 8.7 WSW SWELL 10.6
2026-02-04 05:30 am 9.2 8.2 16.7WNW 4.3 9.5 WSW SWELL 11.5
2026-02-04 05:00 am 7.2 5.9 11.1 W 4.3 9.5 WSW SWELL 10.2
2026-02-04 04:30 am 8.2 6.9 16.7 W 4.3 9.5 WSW SWELL 10.8
2026-02-04 04:00 am 8.5 7.2 11.8 W 4.6 9.5 WSW SWELL 10.6
2026-02-04 03:30 am 7.5 6.6 11.1WSW 4.3 9.5 WSW SWELL 10.3
2026-02-04 03:00 am 8.5 7.2 16.7WNW 4.3 9.5 WSW SWELL 11.0
2026-02-04 02:30 am 7.5 6.2 12.5 W 4.3 8.0 WSW SWELL 10.4
2026-02-04 02:00 am 7.9 6.6 11.8WSW 3.9 9.5 W SWELL 10.3
2026-02-04 01:30 am 7.5 5.9 10.5 W 4.6 9.5 W SWELL 10.0
2026-02-04 01:00 am 7.5 6.2 18.2WNW 4.3 9.5 W SWELL 10.6
2026-02-04 12:30 am 7.2 6.2 11.1 W 3.9 9.5 W SWELL 10.4
2026-02-04 12:00 am 7.5 6.2 18.2WNW 3.9 9.5 W SWELL 10.6
2026-02-03 11:30 pm 6.2 5.2 10.5 W 3.6 9.5 WSW SWELL 10.1
2026-02-03 11:00 pm 6.6 5.2 18.2WNW 3.9 9.5 W SWELL 10.3
2026-02-03 10:30 pm 5.9 4.6 18.2 W 3.9 9.5 W SWELL 9.6
2026-02-03 10:00 pm 6.2 4.9 10.5 W 3.6 9.5 W SWELL 9.8
2026-02-03 09:30 pm 5.9 4.6 18.2 W 3.6 9.1 W SWELL 9.7
2026-02-03 09:00 pm 5.9 4.6 18.2 W 3.6 9.5 W SWELL 9.6

Plot icon Plot of wave energy versus frequency (and period)