


Station 46215 - Diablo Canyon, CA (076) 
Information submitted by Scripps Institution of Oceanography
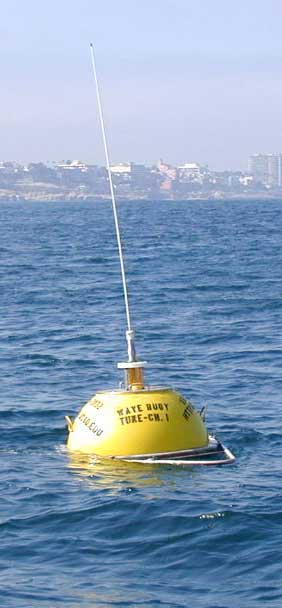
Waverider Buoy
35.204 N 120.859 W (35°12'14" N 120°51'34" W)
Site elevation: sea level
Sea temp depth: 0.46 m below water line
Water depth: 27.4 m
Large icon indicates selected station.
 Stations with recent data
 Stations with no data in last 8 hours
(24 hours for tsunami stations)
(24 hours for tsunami stations)
|
Click on the graph icon in the table below to see a time series plot of the last five days of that observation. | |
| 3.0 ft | |
| 8 sec | |
| 7.6 sec | |
| WNW ( 290 deg true ) | |
| 58.8 °F | |
| TIME (PDT) |
WDIR |
WSPD kts |
GST kts |
WVHT ft |
DPD sec |
APD sec |
MWD |
PRES in |
PTDY in |
ATMP °F |
WTMP °F |
DEWP °F |
SAL psu |
VIS nmi |
TIDE ft |
|---|---|---|---|---|---|---|---|---|---|---|---|---|---|---|---|
| 2026-07-14 04:56 am | - | - | - | 3.0 | 13 | 7.7 | SW | - | - | - | 60.8 | - | - | - | - |
| 2026-07-14 04:26 am | - | - | - | 3.0 | 13 | 7.5 | SSW | - | - | - | 61.9 | - | - | - | - |
| 2026-07-14 03:56 am | - | - | - | 3.0 | 13 | 7.5 | SW | - | - | - | 60.6 | - | - | - | - |
| 2026-07-14 03:26 am | - | - | - | 3.3 | 9 | 7.8 | WNW | - | - | - | 58.1 | - | - | - | - |
| 2026-07-14 02:56 am | - | - | - | 3.0 | 8 | 7.6 | WNW | - | - | - | 57.0 | - | - | - | - |
| 2026-07-14 02:26 am | - | - | - | 3.0 | 8 | 7.6 | WNW | - | - | - | 57.6 | - | - | - | - |
| 2026-07-14 01:56 am | - | - | - | 3.0 | 13 | 7.7 | SSW | - | - | - | 57.2 | - | - | - | - |
| 2026-07-14 01:26 am | - | - | - | 3.0 | 13 | 7.6 | SSW | - | - | - | 57.6 | - | - | - | - |
| 2026-07-14 12:56 am | - | - | - | 3.3 | 13 | 7.5 | SSW | - | - | - | 57.6 | - | - | - | - |
| 2026-07-14 12:26 am | - | - | - | 3.3 | 13 | 7.8 | SW | - | - | - | 57.6 | - | - | - | - |
| 2026-07-13 11:56 pm | - | - | - | 3.6 | 13 | 7.8 | SSW | - | - | - | 57.6 | - | - | - | - |
| 2026-07-13 11:26 pm | - | - | - | 3.3 | 14 | 7.3 | SSW | - | - | - | 57.4 | - | - | - | - |
| 2026-07-13 10:56 pm | - | - | - | 3.6 | 13 | 7.7 | SSW | - | - | - | 57.6 | - | - | - | - |
| 2026-07-13 10:26 pm | - | - | - | 3.3 | 13 | 7.5 | SSW | - | - | - | 57.9 | - | - | - | - |
| 2026-07-13 09:56 pm | - | - | - | 3.3 | 13 | 7.2 | SSW | - | - | - | 57.7 | - | - | - | - |
| 2026-07-13 09:26 pm | - | - | - | 3.3 | 13 | 7.1 | SSW | - | - | - | 57.0 | - | - | - | - |
| 2026-07-13 08:56 pm | - | - | - | 3.3 | 8 | 7.0 | WNW | - | - | - | 57.0 | - | - | - | - |
| 2026-07-13 08:26 pm | - | - | - | 3.3 | 13 | 7.4 | SSW | - | - | - | 57.2 | - | - | - | - |
| 2026-07-13 07:56 pm | - | - | - | 3.3 | 13 | 7.3 | SSW | - | - | - | 57.4 | - | - | - | - |
| 2026-07-13 07:26 pm | - | - | - | 3.3 | 13 | 7.5 | SSW | - | - | - | 57.2 | - | - | - | - |
| 2026-07-13 06:56 pm | - | - | - | 3.3 | 13 | 7.2 | SSW | - | - | - | 57.9 | - | - | - | - |
| 2026-07-13 06:26 pm | - | - | - | 3.3 | 10 | 7.0 | WNW | - | - | - | 59.0 | - | - | - | - |
| 2026-07-13 05:56 pm | - | - | - | 3.3 | 13 | 7.0 | SSW | - | - | - | 58.1 | - | - | - | - |
| 2026-07-13 05:26 pm | - | - | - | 3.3 | 8 | 7.2 | WNW | - | - | - | 58.6 | - | - | - | - |
| 2026-07-13 04:56 pm | - | - | - | 3.0 | 13 | 7.2 | SSW | - | - | - | 58.8 | - | - | - | - |
| 2026-07-13 04:26 pm | - | - | - | 3.0 | 13 | 7.6 | SSW | - | - | - | 58.6 | - | - | - | - |
| 2026-07-13 03:56 pm | - | - | - | 3.0 | 13 | 7.9 | SSW | - | - | - | 58.6 | - | - | - | - |
| 2026-07-13 03:26 pm | - | - | - | 2.6 | 13 | 7.2 | SSW | - | - | - | 58.6 | - | - | - | - |
| 2026-07-13 02:56 pm | - | - | - | 3.0 | 13 | 7.5 | SW | - | - | - | 58.6 | - | - | - | - |
| 2026-07-13 02:26 pm | - | - | - | 3.3 | 13 | 7.5 | SSW | - | - | - | 58.8 | - | - | - | - |
| 2026-07-13 01:56 pm | - | - | - | 3.3 | 13 | 7.3 | SSW | - | - | - | 59.4 | - | - | - | - |
| 2026-07-13 01:26 pm | - | - | - | 3.3 | 13 | 7.7 | SSW | - | - | - | 58.5 | - | - | - | - |
| 2026-07-13 12:56 pm | - | - | - | 3.3 | 13 | 7.8 | SSW | - | - | - | 59.7 | - | - | - | - |
| 2026-07-13 12:26 pm | - | - | - | 3.3 | 14 | 7.7 | SSW | - | - | - | 59.9 | - | - | - | - |
| 2026-07-13 11:56 am | - | - | - | 3.3 | 13 | 7.6 | SW | - | - | - | 60.3 | - | - | - | - |
| 2026-07-13 11:26 am | - | - | - | 3.3 | 14 | 7.7 | SW | - | - | - | 57.7 | - | - | - | - |
| 2026-07-13 10:56 am | - | - | - | 3.0 | 14 | 7.4 | SSW | - | - | - | 59.2 | - | - | - | - |
| 2026-07-13 10:26 am | - | - | - | 3.0 | 14 | 7.7 | SW | - | - | - | 61.5 | - | - | - | - |
| 2026-07-13 09:56 am | - | - | - | 3.0 | 14 | 7.8 | SW | - | - | - | 61.3 | - | - | - | - |
| 2026-07-13 09:26 am | - | - | - | 3.0 | 13 | 7.9 | SSW | - | - | - | 62.2 | - | - | - | - |
| 2026-07-13 08:56 am | - | - | - | 3.3 | 13 | 7.9 | SSW | - | - | - | 63.5 | - | - | - | - |
| 2026-07-13 08:26 am | - | - | - | 3.3 | 14 | 8.0 | SSW | - | - | - | 61.0 | - | - | - | - |
| 2026-07-13 07:56 am | - | - | - | 3.0 | 13 | 8.0 | SSW | - | - | - | 57.2 | - | - | - | - |
| 2026-07-13 07:26 am | - | - | - | 3.0 | 13 | 8.0 | SSW | - | - | - | 57.4 | - | - | - | - |
| 2026-07-13 06:56 am | - | - | - | 3.0 | 10 | 7.6 | WNW | - | - | - | 57.7 | - | - | - | - |
| 2026-07-13 06:26 am | - | - | - | 3.0 | 14 | 7.9 | SSW | - | - | - | 58.6 | - | - | - | - |
| 2026-07-13 05:56 am | - | - | - | 2.6 | 13 | 7.5 | SSW | - | - | - | 60.1 | - | - | - | - |
|
These wave data are displayed in rounded times. Click on the graph icon in the table below to see a time series plot of the last five days of that observation. | |
| 3.0 ft | |
| 1.6 ft | |
| 12.5 sec | |
| SSW | |
| 2.6 ft | |
| 8.3 sec | |
| WNW | |
| AVERAGE | |
| 7.6 sec | |
| TIME (PDT) |
WVHT ft |
SwH ft |
SwP sec |
SwD |
WWH ft |
WWP sec |
WWD |
STEEPNESS |
APD sec |
|---|---|---|---|---|---|---|---|---|---|
| 2026-07-14 04:56 am | 3.0 | 1.6 | 13.3 | SW | 2.3 | 9.9 | W | AVERAGE | 7.7 |
| 2026-07-14 04:26 am | 3.0 | 1.6 | 12.5 | SSW | 2.3 | 7.7 | WNW | AVERAGE | 7.5 |
| 2026-07-14 03:56 am | 3.0 | 1.6 | 13.3 | SW | 2.6 | 8.3 | WNW | AVERAGE | 7.5 |
| 2026-07-14 03:26 am | 3.3 | 1.6 | 13.3 | SW | 2.6 | 9.1 | WNW | AVERAGE | 7.8 |
| 2026-07-14 02:56 am | 3.0 | 1.3 | 12.5 | SSW | 2.6 | 8.3 | WNW | AVERAGE | 7.6 |
| 2026-07-14 02:26 am | 3.0 | 1.6 | 12.5 | SW | 2.6 | 8.3 | WNW | AVERAGE | 7.6 |
| 2026-07-14 01:56 am | 3.0 | 1.6 | 13.3 | SSW | 2.6 | 9.1 | WNW | AVERAGE | 7.7 |
| 2026-07-14 01:26 am | 3.0 | 1.6 | 12.5 | SSW | 2.6 | 8.3 | WNW | AVERAGE | 7.6 |
| 2026-07-14 12:56 am | 3.3 | 1.6 | 13.3 | SSW | 3.0 | 9.1 | WNW | AVERAGE | 7.5 |
| 2026-07-14 12:26 am | 3.3 | 2.0 | 13.3 | SW | 2.6 | 9.1 | W | AVERAGE | 7.8 |
| 2026-07-13 11:56 pm | 3.6 | 2.0 | 12.5 | SSW | 3.0 | 8.3 | W | AVERAGE | 7.8 |
| 2026-07-13 11:26 pm | 3.3 | 1.6 | 14.3 | SSW | 3.0 | 9.1 | WNW | AVERAGE | 7.3 |
| 2026-07-13 10:56 pm | 3.6 | 2.0 | 13.3 | SSW | 3.0 | 7.7 | WNW | AVERAGE | 7.7 |
| 2026-07-13 10:26 pm | 3.3 | 2.0 | 13.3 | SSW | 2.6 | 8.3 | WNW | AVERAGE | 7.5 |
| 2026-07-13 09:56 pm | 3.3 | 1.6 | 13.3 | SSW | 2.6 | 9.1 | WNW | AVERAGE | 7.2 |
| 2026-07-13 09:26 pm | 3.3 | 1.6 | 13.3 | SSW | 2.6 | 9.1 | WNW | AVERAGE | 7.1 |
| 2026-07-13 08:56 pm | 3.3 | 1.3 | 14.3 | SSW | 3.0 | 8.3 | WNW | AVERAGE | 7.0 |
| 2026-07-13 08:26 pm | 3.3 | 1.6 | 13.3 | SSW | 3.0 | 9.1 | WNW | AVERAGE | 7.4 |
| 2026-07-13 07:56 pm | 3.3 | 1.6 | 13.3 | SSW | 2.6 | 9.1 | WNW | AVERAGE | 7.3 |
| 2026-07-13 07:26 pm | 3.3 | 2.0 | 12.5 | SSW | 3.0 | 9.1 | WNW | AVERAGE | 7.5 |
| 2026-07-13 06:56 pm | 3.3 | 2.0 | 13.3 | SSW | 2.6 | 9.1 | WNW | AVERAGE | 7.2 |
| 2026-07-13 06:26 pm | 3.3 | 1.6 | 13.3 | SSW | 3.0 | 9.9 | WNW | AVERAGE | 7.0 |
| 2026-07-13 05:56 pm | 3.3 | 2.0 | 13.3 | SSW | 2.6 | 8.3 | WNW | AVERAGE | 7.0 |
| 2026-07-13 05:26 pm | 3.3 | 1.6 | 13.3 | SSW | 2.6 | 8.3 | WNW | AVERAGE | 7.2 |
| 2026-07-13 04:56 pm | 3.0 | 1.6 | 13.3 | SSW | 2.6 | 8.3 | WNW | AVERAGE | 7.2 |
| 2026-07-13 04:26 pm | 3.0 | 2.0 | 13.3 | SSW | 2.3 | 8.3 | WNW | AVERAGE | 7.6 |
| 2026-07-13 03:56 pm | 3.0 | 2.0 | 13.3 | SSW | 2.3 | 8.3 | W | AVERAGE | 7.9 |
| 2026-07-13 03:26 pm | 2.6 | 1.6 | 13.3 | SSW | 2.3 | 9.1 | WNW | AVERAGE | 7.2 |
| 2026-07-13 02:56 pm | 3.0 | 2.0 | 13.3 | SW | 2.3 | 8.3 | WNW | AVERAGE | 7.5 |
| 2026-07-13 02:26 pm | 3.0 | 2.0 | 13.3 | SSW | 2.6 | 9.1 | WNW | AVERAGE | 7.5 |
| 2026-07-13 01:56 pm | 3.3 | 1.6 | 13.3 | SSW | 2.6 | 8.3 | WNW | AVERAGE | 7.3 |
| 2026-07-13 01:26 pm | 3.3 | 2.0 | 13.3 | SSW | 2.6 | 9.1 | WNW | AVERAGE | 7.7 |
| 2026-07-13 12:56 pm | 3.3 | 2.0 | 13.3 | SSW | 2.6 | 7.7 | WNW | AVERAGE | 7.8 |
| 2026-07-13 12:26 pm | 3.3 | 2.0 | 14.3 | SSW | 2.6 | 7.7 | WNW | AVERAGE | 7.7 |
| 2026-07-13 11:56 am | 3.3 | 1.6 | 12.5 | SW | 3.0 | 8.3 | WNW | AVERAGE | 7.6 |
| 2026-07-13 11:26 am | 3.3 | 2.0 | 14.3 | SW | 3.0 | 8.3 | WNW | AVERAGE | 7.7 |
| 2026-07-13 10:56 am | 3.0 | 1.6 | 14.3 | SSW | 2.3 | 8.3 | WNW | AVERAGE | 7.4 |
| 2026-07-13 10:26 am | 3.0 | 1.6 | 14.3 | SW | 2.6 | 9.1 | WNW | AVERAGE | 7.7 |
| 2026-07-13 09:56 am | 3.0 | 1.6 | 14.3 | SW | 2.6 | 9.1 | WNW | AVERAGE | 7.8 |
| 2026-07-13 09:26 am | 3.0 | 2.0 | 13.3 | SSW | 2.3 | 8.3 | WNW | AVERAGE | 7.9 |
| 2026-07-13 08:56 am | 3.0 | 2.0 | 13.3 | SSW | 2.6 | 9.9 | W | AVERAGE | 7.9 |
| 2026-07-13 08:26 am | 3.3 | 2.0 | 14.3 | SSW | 2.3 | 9.9 | W | AVERAGE | 8.0 |
| 2026-07-13 07:56 am | 3.0 | 2.0 | 12.5 | SSW | 2.3 | 9.1 | WNW | AVERAGE | 8.0 |
| 2026-07-13 07:26 am | 3.0 | 2.0 | 13.3 | SSW | 2.3 | 9.1 | WNW | AVERAGE | 8.0 |
| 2026-07-13 06:56 am | 3.0 | 1.6 | 14.3 | SSW | 2.3 | 9.9 | WNW | AVERAGE | 7.6 |
| 2026-07-13 06:26 am | 3.0 | 1.6 | 14.3 | SSW | 2.3 | 9.1 | WNW | AVERAGE | 7.9 |
| 2026-07-13 05:56 am | 2.6 | 1.6 | 13.3 | SSW | 2.0 | 9.9 | WNW | N/A | 7.5 |
Links which are specific to this station are listed below:
Real Time Data in tabular form for the last forty-five days.
Historical Data & Climatic Summaries for quality controlled data for prior months and years.