


Station 46213 - Cape Mendocino, CA (094)
Information submitted by Scripps Institution of Oceanography
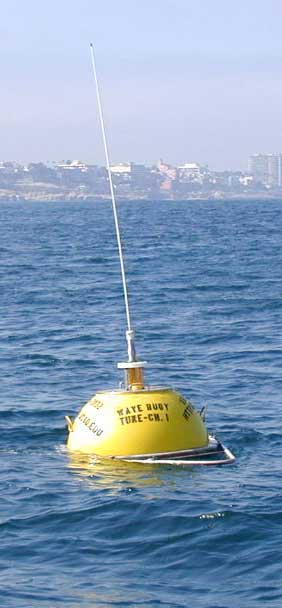
Waverider Buoy
40.295 N 124.732 W (40°17'42" N 124°43'54" W)
Site elevation: sea level
Sea temp depth: 0.46 m below water line
Water depth: 345 m
Large icon indicates selected station.
 Stations with recent data
 Stations with no data in last 8 hours
(24 hours for tsunami stations)
(24 hours for tsunami stations)
No Recent Reports
Links which are specific to this station are listed below:
Data for last 45 days:
- Real time standard meteorological data and their description.
- Real time spectral wave data and their description.
- Real time raw spectral wave data and their description.
- Real time raw spectral wave (alpha1) data and their description.
- Real time raw spectral wave (alpha2) data and their description.
- Real time raw spectral wave (r1) data and their description.
- Real time raw spectral wave (r2) data and their description.
- Quality controlled data for 2024 (data descriptions)
- Historical data (data descriptions)
- Search historical meteorological data for observations that meet your threshold conditions
Some data files have been compressed with the GNU gzip program.