


![]() View the latest observations near East Pacific Hurricane Fausto.
View the latest observations near East Pacific Hurricane Fausto.
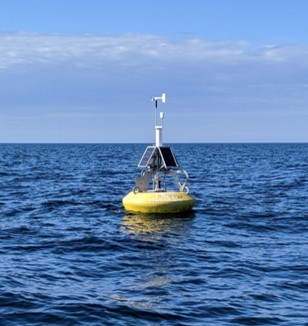
Station 46086 (LLNR 81) - SAN CLEMENTE BASIN - 27NM SE Of San Clemente Is, CA 
Owned and maintained by National Data Buoy Center
2.1-meter ionomer foam buoy
SCOOP payload
32.504 N 118.029 W (32°30'15" N 118°1'44" W)
Site elevation: sea level
Air temp height: 2.8 m above site elevation
Anemometer height: 3.2 m above site elevation
Barometer elevation: 1.8 m above mean sea level
Sea temp depth: 1.1 m below water line
Water depth: 1862 m
Watch circle radius: 1869 yards
(24 hours for tsunami stations)
|
Click on the graph icon in the table below to see a time series plot of the last five days of that observation. | |
| WNW ( 290 deg true ) | |
| 11.7 kts | |
| 15.5 kts | |
| 29.88 in | |
| 65.8 °F | |
| 64.2 °F | |
| 13.6 kts | |
| 15.5 kts | |
|
||||||||||||||||||
| TIME (PDT) |
WDIR |
WSPD kts |
GST kts |
WVHT ft |
DPD sec |
APD sec |
MWD |
PRES in |
PTDY in |
ATMP °F |
WTMP °F |
DEWP °F |
SAL psu |
VIS nmi |
TIDE ft |
|---|---|---|---|---|---|---|---|---|---|---|---|---|---|---|---|
| 2026-07-24 05:30 am | WNW | 13.6 | 15.5 | - | - | - | - | 29.88 | - | 65.8 | 71.8 | 64.4 | - | - | - |
| 2026-07-24 05:20 am | WNW | 13.6 | 15.5 | 6.6 | 8 | 6.4 | WNW | 29.88 | - | 65.8 | 71.8 | 64.2 | - | - | - |
| 2026-07-24 05:10 am | WNW | 13.6 | 15.5 | 6.6 | - | 6.4 | WNW | 29.87 | - | 66.0 | 71.8 | 64.6 | - | - | - |
| 2026-07-24 05:00 am | WNW | 13.6 | 15.5 | - | - | - | - | 29.87 | +0.00 | 66.0 | 71.8 | 64.6 | - | - | - |
| 2026-07-24 04:50 am | WNW | 13.6 | 17.5 | 6.6 | 9 | 6.3 | WNW | 29.87 | - | 66.0 | 71.8 | 64.6 | - | - | - |
| 2026-07-24 04:40 am | WNW | 13.6 | 17.5 | - | - | - | - | 29.87 | - | 66.2 | 71.8 | 64.9 | - | - | - |
| 2026-07-24 04:30 am | WNW | 15.5 | 17.5 | - | - | - | - | 29.87 | - | 66.0 | 71.8 | 64.6 | - | - | - |
| 2026-07-24 04:20 am | WNW | 13.6 | 17.5 | 7.2 | 8 | 6.5 | WNW | 29.87 | - | 66.4 | 71.8 | 65.1 | - | - | - |
| 2026-07-24 04:10 am | WNW | 15.5 | 17.5 | 7.2 | - | 6.5 | WNW | 29.87 | - | 66.2 | 71.8 | 64.8 | - | - | - |
| 2026-07-24 04:00 am | WNW | 15.5 | 17.5 | - | - | - | - | 29.87 | -0.01 | 66.2 | 71.8 | 64.8 | - | - | - |
| 2026-07-24 03:50 am | WNW | 15.5 | 17.5 | 6.6 | 9 | 6.4 | WNW | 29.87 | - | 66.2 | 71.8 | 65.1 | - | - | - |
| 2026-07-24 03:40 am | WNW | 13.6 | 17.5 | 6.6 | - | 6.4 | WNW | 29.87 | - | 66.4 | 71.8 | 65.1 | - | - | - |
| 2026-07-24 03:30 am | WNW | 13.6 | 17.5 | - | - | - | - | 29.86 | - | 66.4 | 71.8 | 65.1 | - | - | - |
| 2026-07-24 03:20 am | WNW | 13.6 | 17.5 | 6.6 | 11 | 6.5 | SSW | 29.87 | - | 66.4 | 71.8 | 65.1 | - | - | - |
| 2026-07-24 03:10 am | W | 13.6 | 17.5 | 6.6 | - | 6.5 | SSW | 29.87 | - | 66.4 | 71.8 | 65.1 | - | - | - |
| 2026-07-24 03:00 am | WNW | 13.6 | 17.5 | - | - | - | - | 29.87 | -0.02 | 66.6 | 71.8 | 65.3 | - | - | - |
| 2026-07-24 02:50 am | W | 13.6 | 15.5 | 7.2 | 9 | 6.5 | WNW | 29.87 | - | 66.4 | 71.8 | 65.1 | - | - | - |
| 2026-07-24 02:40 am | W | 13.6 | 15.5 | 7.2 | - | 6.5 | WNW | 29.87 | - | 66.4 | 71.8 | 65.1 | - | - | - |
| 2026-07-24 02:30 am | W | 11.7 | 13.6 | - | - | - | - | 29.87 | - | 66.6 | 71.8 | 65.5 | - | - | - |
| 2026-07-24 02:20 am | W | 11.7 | 13.6 | 7.2 | 8 | 6.5 | WNW | 29.88 | - | 66.6 | 71.8 | 65.5 | - | - | - |
| 2026-07-24 02:10 am | W | 11.7 | 13.6 | 7.2 | - | 6.5 | WNW | 29.88 | - | 66.6 | 72.0 | 65.5 | - | - | - |
| 2026-07-24 02:00 am | WNW | 11.7 | 13.6 | - | - | - | - | 29.88 | +0.00 | 66.6 | 72.0 | 65.3 | - | - | - |
| 2026-07-24 01:50 am | WNW | 11.7 | 13.6 | 7.2 | 8 | 6.5 | WNW | 29.88 | - | 66.6 | 72.0 | 65.5 | - | - | - |
| 2026-07-24 01:40 am | WNW | 11.7 | 15.5 | 7.2 | - | 6.5 | WNW | 29.88 | - | 66.7 | 72.0 | 65.7 | - | - | - |
| 2026-07-24 01:30 am | WNW | 11.7 | 13.6 | - | - | - | - | 29.88 | - | 66.7 | 72.0 | 65.7 | - | - | - |
| 2026-07-24 01:20 am | WNW | 11.7 | 15.5 | 7.5 | 8 | 6.5 | WNW | 29.88 | - | 66.7 | 72.0 | 65.8 | - | - | - |
| 2026-07-24 01:10 am | WNW | 11.7 | 15.5 | - | - | - | - | 29.88 | - | 66.9 | 72.0 | 65.8 | - | - | - |
| 2026-07-24 01:00 am | WNW | 11.7 | 15.5 | - | - | - | - | 29.88 | -0.01 | 66.9 | 72.0 | 65.8 | - | - | - |
| 2026-07-24 12:50 am | WNW | 13.6 | 15.5 | 7.2 | 8 | 6.4 | WNW | 29.88 | - | 66.9 | 72.0 | 65.8 | - | - | - |
| 2026-07-24 12:40 am | W | 13.6 | 15.5 | 7.2 | - | 6.4 | WNW | 29.88 | - | 66.9 | 72.0 | 65.8 | - | - | - |
| 2026-07-24 12:30 am | WNW | 11.7 | 15.5 | - | - | - | - | 29.88 | - | 67.1 | 72.0 | 66.0 | - | - | - |
| 2026-07-24 12:20 am | WNW | 11.7 | 15.5 | 7.2 | 8 | 6.4 | WNW | 29.88 | - | 67.3 | 72.0 | 66.2 | - | - | - |
| 2026-07-24 12:10 am | WNW | 11.7 | 15.5 | 7.2 | - | 6.4 | WNW | 29.88 | - | 66.9 | 72.0 | 65.8 | - | - | - |
| 2026-07-24 12:00 am | WNW | 13.6 | 15.5 | - | - | - | - | 29.88 | +0.00 | 67.1 | - | 66.0 | - | - | - |
| 2026-07-23 11:50 pm | WNW | 13.6 | 15.5 | 7.2 | - | 6.5 | WNW | 29.88 | - | 67.1 | 72.0 | 66.0 | - | - | - |
| 2026-07-23 11:40 pm | WNW | 13.6 | 17.5 | - | - | - | - | 29.89 | - | 67.1 | 72.0 | 66.2 | - | - | - |
| 2026-07-23 11:30 pm | WNW | 13.6 | 15.5 | - | - | - | - | 29.88 | - | 67.1 | 72.0 | 66.2 | - | - | - |
| 2026-07-23 11:20 pm | WNW | 13.6 | 15.5 | 7.2 | 8 | 6.4 | WNW | 29.88 | - | 67.1 | 72.0 | 66.4 | - | - | - |
| 2026-07-23 11:10 pm | WNW | 11.7 | 13.6 | - | - | - | - | 29.88 | - | 67.1 | 72.0 | 66.4 | - | - | - |
| 2026-07-23 11:00 pm | WNW | 11.7 | 15.5 | - | - | - | - | 29.88 | +0.03 | 67.3 | - | 66.4 | - | - | - |
| 2026-07-23 10:50 pm | WNW | 11.7 | 15.5 | 7.5 | 8 | 6.4 | WNW | 29.89 | - | 67.3 | 72.0 | 66.4 | - | - | - |
| 2026-07-23 10:40 pm | WNW | 13.6 | 15.5 | 7.5 | - | 6.4 | WNW | 29.88 | - | 67.3 | 72.0 | 66.2 | - | - | - |
| 2026-07-23 10:30 pm | WNW | 13.6 | 15.5 | - | - | - | - | 29.89 | - | 67.3 | 72.0 | 66.6 | - | - | - |
| 2026-07-23 10:20 pm | W | 13.6 | 15.5 | 7.2 | 9 | 6.2 | WNW | 29.89 | - | 67.3 | 72.0 | 66.4 | - | - | - |
| 2026-07-23 10:10 pm | W | 13.6 | 15.5 | 7.2 | - | 6.2 | WNW | 29.89 | - | 67.5 | 72.0 | 66.6 | - | - | - |
| 2026-07-23 10:00 pm | W | 13.6 | 17.5 | - | - | - | - | 29.88 | +0.04 | 67.5 | 72.0 | 66.2 | - | - | - |
| 2026-07-23 09:50 pm | W | 13.6 | 15.5 | 7.2 | 8 | 6.2 | WNW | 29.88 | - | 67.6 | 72.0 | 66.2 | - | - | - |
| 2026-07-23 09:40 pm | WNW | 13.6 | 15.5 | 7.2 | - | 6.2 | WNW | 29.88 | - | 67.5 | 72.0 | 66.4 | - | - | - |
| 2026-07-23 09:30 pm | WNW | 11.7 | 15.5 | - | - | - | - | 29.88 | - | 67.8 | 72.0 | 66.7 | - | - | - |
| 2026-07-23 09:20 pm | WNW | 11.7 | 15.5 | - | - | - | - | 29.88 | - | 67.6 | 72.0 | 66.4 | - | - | - |
| 2026-07-23 09:10 pm | WNW | 13.6 | 15.5 | - | - | - | - | 29.88 | - | 67.5 | 72.0 | 66.4 | - | - | - |
| 2026-07-23 09:00 pm | - | - | - | - | - | - | - | 29.87 | +0.04 | - | 72.0 | - | - | - | - |
| 2026-07-23 08:50 pm | WNW | 13.6 | 17.5 | 7.2 | 7 | 6.1 | WNW | 29.87 | - | 67.6 | 72.0 | 66.4 | - | - | - |
| 2026-07-23 08:40 pm | WNW | 13.6 | 17.5 | - | - | - | - | 29.87 | - | 67.6 | 72.0 | 66.4 | - | - | - |
| 2026-07-23 08:30 pm | WNW | 15.5 | 17.5 | - | - | - | - | 29.86 | - | 67.6 | 72.0 | 66.6 | - | - | - |
| 2026-07-23 08:20 pm | WNW | 13.6 | 17.5 | 7.5 | 8 | 6.3 | WNW | 29.86 | - | 67.6 | 72.1 | 66.6 | - | - | - |
| 2026-07-23 08:10 pm | WNW | 15.5 | 17.5 | 7.5 | - | 6.3 | WNW | 29.86 | - | 67.6 | 72.0 | 66.6 | - | - | - |
| 2026-07-23 08:00 pm | WNW | 15.5 | 17.5 | - | - | - | - | 29.85 | +0.01 | 67.6 | 72.0 | 66.6 | - | - | - |
| 2026-07-23 07:50 pm | WNW | 13.6 | 17.5 | 6.9 | 8 | 6.0 | WNW | 29.85 | - | 67.6 | 72.1 | 66.6 | - | - | - |
| 2026-07-23 07:40 pm | WNW | 13.6 | 17.5 | - | - | - | - | 29.85 | - | 67.8 | 72.1 | 66.6 | - | - | - |
| 2026-07-23 07:30 pm | WNW | 15.5 | 17.5 | - | - | - | - | 29.85 | - | 67.8 | 72.1 | 66.6 | - | - | - |
| 2026-07-23 07:20 pm | WNW | 15.5 | 19.4 | 7.2 | 8 | 6.1 | WNW | 29.85 | - | 67.6 | 72.1 | 66.4 | - | - | - |
| 2026-07-23 07:10 pm | WNW | 15.5 | 19.4 | 7.2 | - | 6.1 | WNW | 29.84 | - | 67.6 | 72.1 | 66.4 | - | - | - |
| 2026-07-23 07:00 pm | WNW | 15.5 | 17.5 | - | - | - | - | 29.84 | +0.01 | 67.8 | 72.1 | 66.6 | - | - | - |
| 2026-07-23 06:50 pm | WNW | 15.5 | 17.5 | 6.9 | 7 | 5.9 | WNW | 29.84 | - | 67.8 | 72.1 | 66.4 | - | - | - |
| 2026-07-23 06:40 pm | WNW | 15.5 | 17.5 | - | - | - | - | 29.83 | - | 67.8 | - | 66.4 | - | - | - |
| 2026-07-23 06:30 pm | WNW | 15.5 | 19.4 | - | - | - | - | 29.83 | - | 67.8 | 72.1 | 66.4 | - | - | - |
| 2026-07-23 06:20 pm | WNW | 15.5 | 19.4 | 7.2 | 7 | 6.2 | WNW | 29.83 | - | 67.8 | 72.1 | 66.4 | - | - | - |
| 2026-07-23 06:10 pm | WNW | 15.5 | 17.5 | 7.2 | - | 6.2 | WNW | 29.83 | - | 67.8 | 72.1 | 66.4 | - | - | - |
| 2026-07-23 06:00 pm | WNW | 15.5 | 17.5 | - | - | - | - | 29.83 | -0.03 | 67.8 | 72.1 | 66.4 | - | - | - |
| 2026-07-23 05:50 pm | WNW | 15.5 | 17.5 | 6.9 | 8 | 6.1 | WNW | 29.84 | - | 68.0 | 72.1 | 66.6 | - | - | - |
| 2026-07-23 05:40 pm | WNW | 15.5 | 19.4 | - | - | - | - | 29.84 | - | 67.8 | 72.1 | 65.8 | - | - | - |
| 2026-07-23 05:30 pm | WNW | 15.5 | 19.4 | - | - | - | - | 29.84 | - | 68.0 | 72.1 | 66.2 | - | - | - |
| 2026-07-23 05:20 pm | WNW | 15.5 | 19.4 | 6.9 | 8 | 6.2 | WNW | 29.84 | - | 68.0 | 72.1 | 66.2 | - | - | - |
| 2026-07-23 05:10 pm | WNW | 15.5 | 17.5 | 6.9 | - | 6.2 | WNW | 29.84 | - | 68.0 | 72.1 | 66.4 | - | - | - |
| 2026-07-23 05:00 pm | WNW | 15.5 | 17.5 | - | - | - | - | 29.84 | -0.03 | 68.0 | 72.1 | 66.4 | - | - | - |
| 2026-07-23 04:50 pm | WNW | 15.5 | 17.5 | 6.9 | 8 | 6.2 | WNW | 29.84 | - | 68.0 | 72.1 | 66.4 | - | - | - |
| 2026-07-23 04:40 pm | WNW | 15.5 | 19.4 | - | - | - | - | 29.85 | - | 67.6 | 72.1 | 66.2 | - | - | - |
| 2026-07-23 04:20 pm | WNW | 15.5 | 19.4 | 6.9 | 8 | 6.2 | WNW | 29.84 | - | 67.8 | 72.1 | 66.6 | - | - | - |
| 2026-07-23 04:10 pm | WNW | 15.5 | 19.4 | 6.9 | - | 6.2 | WNW | 29.84 | - | 68.0 | 72.1 | 66.9 | - | - | - |
| 2026-07-23 04:00 pm | WNW | 15.5 | 19.4 | - | - | - | - | 29.84 | -0.04 | 67.8 | 72.1 | 66.6 | - | - | - |
| 2026-07-23 03:50 pm | WNW | 15.5 | 19.4 | 6.9 | 8 | 6.3 | WNW | 29.84 | - | 67.6 | 72.1 | 66.6 | - | - | - |
| 2026-07-23 03:40 pm | WNW | 17.5 | 19.4 | - | - | - | - | 29.84 | - | 67.8 | 72.1 | 66.7 | - | - | - |
| 2026-07-23 03:30 pm | WNW | 17.5 | 19.4 | - | - | - | - | 29.84 | - | 67.8 | 72.1 | 66.7 | - | - | - |
| 2026-07-23 03:20 pm | WNW | 15.5 | 19.4 | 7.2 | 8 | 6.3 | WNW | 29.85 | - | 67.6 | 72.1 | 66.6 | - | - | - |
| 2026-07-23 03:10 pm | WNW | 15.5 | 19.4 | - | - | - | - | 29.85 | - | 68.0 | 72.1 | 66.7 | - | - | - |
| 2026-07-23 03:00 pm | WNW | 15.5 | 17.5 | - | - | - | - | 29.85 | -0.04 | 67.8 | 72.1 | 66.6 | - | - | - |
| 2026-07-23 02:50 pm | WNW | 15.5 | 17.5 | 6.6 | 8 | 6.3 | WNW | 29.86 | - | 67.8 | 72.1 | 66.6 | - | - | - |
| 2026-07-23 02:40 pm | WNW | 15.5 | 17.5 | - | - | - | - | 29.86 | - | 67.8 | 72.1 | 66.6 | - | - | - |
| 2026-07-23 02:30 pm | WNW | 15.5 | 17.5 | - | - | - | - | 29.87 | - | 67.8 | 72.1 | 66.7 | - | - | - |
| 2026-07-23 02:20 pm | WNW | 15.5 | 17.5 | 7.2 | 8 | 6.6 | WNW | 29.87 | - | 67.8 | 72.1 | 66.6 | - | - | - |
| 2026-07-23 02:10 pm | WNW | 15.5 | 17.5 | 7.2 | - | 6.6 | WNW | 29.87 | - | 67.6 | 72.1 | 66.4 | - | - | - |
| 2026-07-23 02:00 pm | WNW | 15.5 | 17.5 | - | - | - | - | 29.88 | -0.02 | 67.8 | 72.1 | 66.6 | - | - | - |
| 2026-07-23 01:50 pm | WNW | 15.5 | 17.5 | 6.6 | 8 | 6.4 | WNW | 29.88 | - | 67.6 | 72.1 | 66.4 | - | - | - |
| 2026-07-23 01:40 pm | WNW | 15.5 | 17.5 | - | - | - | - | 29.88 | - | 67.6 | 72.1 | 66.2 | - | - | - |
| 2026-07-23 01:30 pm | WNW | 15.5 | 19.4 | - | - | - | - | 29.88 | - | 67.6 | 72.1 | 66.4 | - | - | - |
| 2026-07-23 01:20 pm | WNW | 15.5 | 19.4 | 6.6 | 8 | 6.4 | WNW | 29.88 | - | - | 72.1 | - | - | - | - |
| 2026-07-23 01:10 pm | WNW | 15.5 | 17.5 | 6.6 | - | 6.4 | WNW | 29.88 | - | 67.6 | 72.1 | 66.4 | - | - | - |
| 2026-07-23 01:00 pm | WNW | 15.5 | 17.5 | - | - | - | - | 29.88 | -0.01 | 67.8 | 72.1 | 66.7 | - | - | - |
| 2026-07-23 12:50 pm | WNW | 13.6 | 17.5 | 6.9 | 8 | 6.6 | WNW | 29.88 | - | 67.6 | 72.1 | 66.4 | - | - | - |
| 2026-07-23 12:40 pm | WNW | 13.6 | 17.5 | - | - | - | - | 29.89 | - | 67.3 | 72.1 | 65.8 | - | - | - |
| 2026-07-23 12:30 pm | WNW | 13.6 | 15.5 | - | - | - | - | 29.89 | - | 67.5 | 72.0 | 66.2 | - | - | - |
| 2026-07-23 12:20 pm | WNW | 13.6 | 15.5 | 6.6 | 8 | 6.4 | WNW | 29.89 | - | 67.6 | 72.0 | 66.4 | - | - | - |
| 2026-07-23 12:10 pm | - | - | - | 6.6 | 8 | - | - | - | - | - | - | - | - | - | - |
| 2026-07-23 12:00 pm | WNW | 13.6 | 17.5 | - | - | - | - | 29.90 | +0.00 | 67.6 | 72.0 | 66.0 | - | - | - |
| 2026-07-23 11:50 am | WNW | 11.7 | 15.5 | 6.6 | 8 | 6.5 | WNW | 29.90 | - | 67.6 | 72.0 | 66.0 | - | - | - |
| 2026-07-23 11:40 am | WNW | 11.7 | 15.5 | - | - | - | - | 29.90 | - | 67.6 | 72.0 | 65.8 | - | - | - |
| 2026-07-23 11:30 am | WNW | 13.6 | 15.5 | - | - | - | - | 29.90 | - | 67.6 | 72.0 | 65.8 | - | - | - |
| 2026-07-23 11:20 am | WNW | 13.6 | 15.5 | 6.9 | 8 | 6.5 | WNW | 29.90 | - | 67.6 | 72.0 | 66.0 | - | - | - |
| 2026-07-23 11:10 am | WNW | 13.6 | 17.5 | 6.9 | - | 6.5 | WNW | 29.90 | - | 67.5 | 71.8 | 65.7 | - | - | - |
| 2026-07-23 11:00 am | WNW | 13.6 | 17.5 | - | - | - | - | 29.90 | -0.01 | 67.6 | 71.8 | 66.2 | - | - | - |
| 2026-07-23 10:50 am | WNW | 13.6 | 15.5 | 7.2 | 8 | 6.5 | WNW | 29.89 | - | 67.5 | 71.8 | 65.7 | - | - | - |
| 2026-07-23 10:40 am | - | - | - | 7.2 | 8 | - | - | - | - | - | - | - | - | - | - |
| 2026-07-23 10:30 am | WNW | 13.6 | 15.5 | - | - | - | - | 29.90 | - | 67.3 | 71.8 | 65.5 | - | - | - |
| 2026-07-23 10:20 am | WNW | 13.6 | 15.5 | 7.5 | 8 | 6.5 | WNW | 29.90 | - | 67.3 | 71.8 | 65.5 | - | - | - |
| 2026-07-23 10:10 am | WNW | 13.6 | 15.5 | - | - | - | - | 29.90 | - | 67.1 | 71.8 | 65.1 | - | - | - |
| 2026-07-23 10:00 am | WNW | 13.6 | 15.5 | - | - | - | - | 29.90 | -0.01 | 67.1 | 71.8 | 64.9 | - | - | - |
| 2026-07-23 09:50 am | WNW | 13.6 | 15.5 | 7.2 | 8 | 6.5 | WNW | 29.89 | - | 67.1 | 71.8 | 64.9 | - | - | - |
| 2026-07-23 09:40 am | WNW | 13.6 | 15.5 | - | - | - | - | 29.90 | - | 67.1 | 71.8 | 64.9 | - | - | - |
| 2026-07-23 09:30 am | WNW | 13.6 | 15.5 | - | - | - | - | 29.90 | - | 66.9 | 71.8 | 64.8 | - | - | - |
| 2026-07-23 09:20 am | WNW | 13.6 | 15.5 | 6.9 | 8 | 6.3 | WNW | 29.90 | - | 66.9 | 71.8 | 64.8 | - | - | - |
| 2026-07-23 09:10 am | WNW | 13.6 | 15.5 | 6.9 | - | 6.3 | WNW | 29.90 | - | 66.9 | 71.8 | 64.8 | - | - | - |
| 2026-07-23 09:00 am | WNW | 11.7 | 15.5 | - | - | - | - | 29.90 | +0.02 | 67.1 | 71.8 | 64.9 | - | - | - |
| 2026-07-23 08:50 am | WNW | 11.7 | 15.5 | 6.9 | 8 | 6.4 | WNW | 29.90 | - | 66.9 | 71.8 | 64.6 | - | - | - |
| 2026-07-23 08:40 am | WNW | 11.7 | 15.5 | - | - | - | - | 29.91 | - | 67.1 | 71.8 | 64.8 | - | - | - |
| 2026-07-23 08:30 am | WNW | 13.6 | 15.5 | - | - | - | - | 29.91 | - | 66.9 | 71.8 | 64.6 | - | - | - |
| 2026-07-23 08:20 am | WNW | 13.6 | 15.5 | 6.9 | 7 | 6.4 | WNW | 29.91 | - | 66.9 | 71.8 | 64.6 | - | - | - |
| 2026-07-23 08:10 am | WNW | 13.6 | 17.5 | 6.9 | - | 6.4 | WNW | 29.91 | - | 67.1 | 71.8 | 64.9 | - | - | - |
| 2026-07-23 08:00 am | WNW | 13.6 | 15.5 | - | - | - | - | 29.90 | +0.03 | 66.9 | 71.8 | 64.6 | - | - | - |
| 2026-07-23 07:50 am | WNW | 13.6 | 17.5 | 7.5 | 8 | 6.5 | WNW | 29.90 | - | 66.9 | 71.8 | 64.6 | - | - | - |
| 2026-07-23 07:40 am | WNW | 13.6 | 17.5 | - | - | - | - | 29.90 | - | 66.9 | 71.8 | 64.6 | - | - | - |
| 2026-07-23 07:30 am | WNW | 13.6 | 15.5 | - | - | - | - | 29.90 | - | 66.9 | 71.8 | 64.4 | - | - | - |
| 2026-07-23 07:20 am | WNW | 13.6 | 15.5 | 7.2 | 12 | 6.3 | S | 29.90 | - | 66.9 | 71.8 | 64.4 | - | - | - |
| 2026-07-23 07:10 am | WNW | 13.6 | 15.5 | 7.2 | - | 6.3 | S | 29.90 | - | 66.7 | 71.8 | 64.2 | - | - | - |
| 2026-07-23 07:00 am | WNW | 13.6 | 15.5 | - | - | - | - | 29.90 | +0.02 | 66.9 | 71.8 | 64.6 | - | - | - |
| 2026-07-23 06:50 am | WNW | 13.6 | 15.5 | 7.2 | 7 | 6.2 | WNW | 29.89 | - | 66.9 | 71.6 | 64.6 | - | - | - |
| 2026-07-23 06:40 am | WNW | 13.6 | 17.5 | - | - | - | - | 29.89 | - | 66.9 | 71.6 | 64.8 | - | - | - |
| 2026-07-23 06:30 am | WNW | 13.6 | 17.5 | - | - | - | - | 29.89 | - | 66.9 | 71.6 | 64.8 | - | - | - |
| 2026-07-23 06:20 am | WNW | 13.6 | 17.5 | 7.2 | 7 | 6.3 | WNW | 29.88 | - | 67.1 | 71.6 | 65.1 | - | - | - |
| 2026-07-23 06:10 am | WNW | 13.6 | 15.5 | 7.2 | - | 6.3 | WNW | 29.89 | - | 67.1 | 71.6 | 65.1 | - | - | - |
| 2026-07-23 06:00 am | WNW | 13.6 | 17.5 | - | - | - | - | 29.88 | +0.01 | 66.9 | 71.6 | 64.9 | - | - | - |
| 2026-07-23 05:50 am | WNW | 15.5 | 17.5 | 7.2 | 14 | 6.5 | SSW | 29.88 | - | 67.1 | 71.6 | 65.1 | - | - | - |
|
These wave data are displayed in rounded times. Click on the graph icon in the table below to see a time series plot of the last five days of that observation. | |
| 6.6 ft | |
| 5.2 ft | |
| 7.7 sec | |
| WNW | |
| 3.6 ft | |
| 6.2 sec | |
| WNW | |
| STEEP | |
| 6.4 sec | |
| TIME (PDT) |
WVHT ft |
SwH ft |
SwP sec |
SwD |
WWH ft |
WWP sec |
WWD |
STEEPNESS |
APD sec |
|---|---|---|---|---|---|---|---|---|---|
| 2026-07-24 04:40 am | 6.6 | 5.2 | 9.1 | WNW | 3.9 | 4.5 | WNW | AVERAGE | 6.3 |
| 2026-07-24 04:10 am | 7.2 | 5.9 | 8.3 | WNW | 4.3 | 6.2 | WNW | STEEP | 6.5 |
| 2026-07-24 03:40 am | 6.6 | 5.2 | 9.1 | WNW | 3.9 | 5.3 | WNW | AVERAGE | 6.4 |
| 2026-07-24 03:10 am | 6.6 | 5.2 | 11.4 | SSW | 3.9 | 5.9 | WNW | SWELL | 6.5 |
| 2026-07-24 02:40 am | 7.2 | 5.9 | 9.1 | WNW | 3.9 | 6.2 | WNW | AVERAGE | 6.5 |
| 2026-07-24 02:10 am | 7.2 | 6.2 | 8.3 | WNW | 3.3 | 5.0 | WNW | STEEP | 6.5 |
| 2026-07-24 01:40 am | 7.2 | 6.6 | 8.3 | WNW | 3.3 | 5.0 | WNW | STEEP | 6.5 |
| 2026-07-24 01:10 am | 7.5 | 6.6 | 7.7 | WNW | 3.3 | 4.5 | WNW | STEEP | 6.5 |
| 2026-07-24 12:40 am | 7.2 | 6.2 | 7.7 | WNW | 3.9 | 5.9 | WNW | STEEP | 6.4 |
| 2026-07-24 12:10 am | 7.2 | 6.2 | 8.3 | WNW | 3.6 | 4.8 | WNW | STEEP | 6.4 |
| 2026-07-23 11:40 pm | 7.2 | 6.2 | 8.3 | WNW | 3.6 | 5.3 | WNW | STEEP | 6.5 |
| 2026-07-23 11:10 pm | 7.2 | 6.2 | 8.3 | WNW | 3.9 | 5.6 | WNW | STEEP | 6.4 |
| 2026-07-23 10:40 pm | 7.5 | 6.6 | 8.3 | WNW | 3.6 | 5.3 | WNW | STEEP | 6.4 |
| 2026-07-23 10:10 pm | 7.2 | 5.9 | 9.1 | WNW | 3.9 | 5.3 | WNW | AVERAGE | 6.2 |
| 2026-07-23 09:40 pm | 7.2 | 5.9 | 8.3 | WNW | 4.6 | 6.7 | WNW | STEEP | 6.2 |
| 2026-07-23 08:40 pm | 7.2 | 4.9 | 11.4 | SSW | 5.6 | 7.1 | WNW | STEEP | 6.1 |
| 2026-07-23 08:10 pm | 7.5 | 5.6 | 7.7 | WNW | 5.2 | 5.6 | WNW | STEEP | 6.3 |
| 2026-07-23 07:40 pm | 6.9 | 4.6 | 8.3 | WNW | 5.2 | 6.7 | WNW | AVERAGE | 6.0 |
| 2026-07-23 07:10 pm | 7.2 | 4.6 | 8.3 | WNW | 5.6 | 7.1 | WNW | STEEP | 6.1 |
| 2026-07-23 06:40 pm | 6.9 | 4.6 | 12.9 | S | 5.2 | 7.1 | WNW | STEEP | 5.9 |
| 2026-07-23 06:10 pm | 7.2 | 4.6 | 8.3 | WNW | 5.6 | 7.1 | WNW | STEEP | 6.2 |
| 2026-07-23 05:40 pm | 6.9 | 4.6 | 8.3 | WNW | 4.9 | 6.7 | WNW | AVERAGE | 6.1 |
| 2026-07-23 05:10 pm | 6.9 | 4.9 | 8.3 | WNW | 4.9 | 7.1 | WNW | AVERAGE | 6.2 |
| 2026-07-23 04:40 pm | 6.9 | 5.2 | 8.3 | WNW | 4.3 | 6.2 | WNW | AVERAGE | 6.2 |
| 2026-07-23 04:10 pm | 6.9 | 4.6 | 8.3 | WNW | 5.2 | 6.7 | WNW | AVERAGE | 6.2 |
| 2026-07-23 03:40 pm | 6.9 | 5.6 | 8.3 | WNW | 3.9 | 4.8 | WNW | AVERAGE | 6.3 |
| 2026-07-23 03:10 pm | 7.2 | 5.6 | 7.7 | WNW | 4.9 | 6.7 | WNW | STEEP | 6.3 |
| 2026-07-23 02:40 pm | 6.6 | 5.2 | 8.3 | WNW | 3.9 | 4.3 | WNW | AVERAGE | 6.3 |
| 2026-07-23 02:10 pm | 7.2 | 5.9 | 8.3 | WNW | 4.3 | 6.7 | WNW | STEEP | 6.6 |
| 2026-07-23 01:40 pm | 6.6 | 5.2 | 7.7 | WNW | 4.3 | 6.2 | WNW | STEEP | 6.4 |
| 2026-07-23 01:10 pm | 6.6 | 4.9 | 8.3 | WNW | 4.6 | 7.1 | WNW | AVERAGE | 6.4 |
| 2026-07-23 12:40 pm | 6.9 | 5.2 | 8.3 | WNW | 4.3 | 7.1 | W | AVERAGE | 6.6 |
| 2026-07-23 12:10 pm | 6.6 | 5.6 | 7.7 | WNW | 3.6 | 5.3 | W | STEEP | 6.4 |
| 2026-07-23 11:40 am | 6.6 | 5.9 | 8.3 | WNW | 3.0 | 4.8 | W | AVERAGE | 6.5 |
| 2026-07-23 11:10 am | 6.9 | 5.6 | 7.7 | WNW | 4.3 | 6.7 | WNW | STEEP | 6.5 |
| 2026-07-23 10:40 am | 7.2 | 5.9 | 8.3 | WNW | 3.9 | 5.3 | WNW | STEEP | 6.5 |
| 2026-07-23 10:10 am | 7.5 | 6.6 | 8.3 | WNW | 3.6 | 5.6 | WNW | STEEP | 6.5 |
| 2026-07-23 09:40 am | 7.2 | 5.9 | 7.7 | WNW | 3.9 | 5.3 | WNW | STEEP | 6.5 |
| 2026-07-23 09:10 am | 6.9 | 5.9 | 7.7 | WNW | 3.9 | 6.2 | WNW | STEEP | 6.3 |
| 2026-07-23 08:40 am | 6.9 | 5.9 | 7.7 | WNW | 3.6 | 5.6 | WNW | STEEP | 6.4 |
| 2026-07-23 08:10 am | 6.9 | 5.9 | 7.1 | WNW | 3.6 | 6.2 | WNW | STEEP | 6.4 |
| 2026-07-23 07:40 am | 7.5 | 5.9 | 7.7 | WNW | 4.6 | 4.5 | WNW | STEEP | 6.5 |
| 2026-07-23 07:10 am | 7.2 | 6.2 | 12.1 | S | 3.9 | 4.8 | WNW | SWELL | 6.3 |
| 2026-07-23 06:40 am | 7.2 | 5.6 | 7.1 | WNW | 4.3 | 5.6 | WNW | STEEP | 6.2 |
| 2026-07-23 06:10 am | 7.2 | 4.9 | 12.9 | S | 5.6 | 7.1 | WNW | STEEP | 6.3 |
Links which are specific to this station are listed below:
Real Time Data in tabular form for the last forty-five days.
Historical Data & Climatic Summaries for quality controlled data for prior months and years.
The weekly status report and the weekly maintenance report also provide valuable station information.
Note that the payload types and the station locations occasionally change.