


Station 46015 (LLNR 590) - PORT ORFORD - 15 NM West of Port Orford, OR
Owned and maintained by National Data Buoy Center
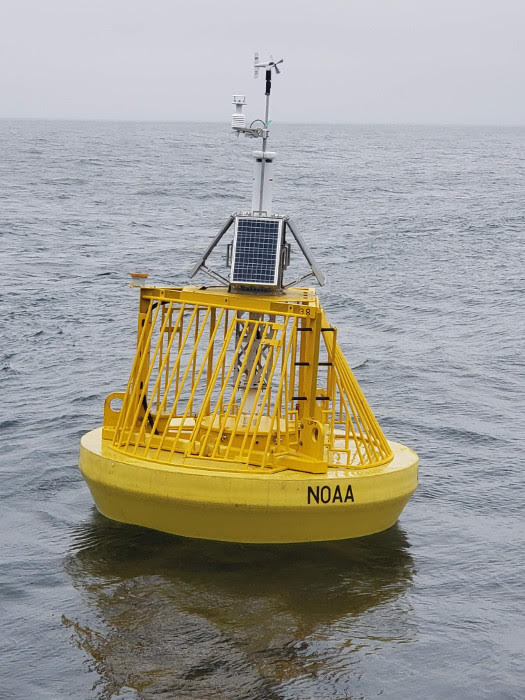
3-meter foam buoy w/ seal cage
SCOOP payload
42.752 N 124.844 W (42°45'9" N 124°50'37" W)
Site elevation: sea level
Air temp height: 3.7 m above site elevation
Anemometer height: 4.1 m above site elevation
Barometer elevation: 2.7 m above mean sea level
Sea temp depth: 1.5 m below water line
Water depth: 446 m
Watch circle radius: 798 yards
(24 hours for tsunami stations)
No Recent Reports
Links which are specific to this station are listed below:
Data for last 24 hours: No data available.
Data for last 5 days: No data available.
Data for last 45 days: No data available.
- Historical data (data descriptions)
- Standard meteorological data: 2002 2003 2004 2005 2006 2007 2008 2009 2010 2011 2012 2013 2014 2015 2016 2017 2018 2019 2020 2021 2022
- Continuous winds data: 2002 2003 2004 2005 2006 2007 2008 2009 2010 2011 2012 2013 2014 2015 2016 2017
- Spectral wave density data: 2002 2003 2004 2005 2006 2007 2007b 2008 2009 2010 2011 2012 2013 2014 2015 2016 2017 2018 2019 2020 2021 2022
- Spectral wave (alpha1) direction data: 2007 2007b 2008 2009 2010 2011 2012 2013 2014 2015 2016 2017 2018 2019 2020 2021 2022
- Spectral wave (alpha2) direction data: 2007 2007b 2008 2009 2010 2011 2012 2013 2014 2015 2016 2017 2018 2019 2020 2021 2022
- Spectral wave (r1) direction data: 2007 2007b 2008 2009 2010 2011 2012 2013 2014 2015 2016 2017 2018 2019 2020 2021 2022
- Spectral wave (r2) direction data: 2007 2007b 2008 2009 2010 2011 2012 2013 2014 2015 2016 2017 2018 2019 2020 2021 2022
- Ocean current data: 2011
- Solar radiation data: 2007 2008
- Supplemental measurements data: 2010 2017 2018 2019 2020 2021 2022
- Ocean data: 2007 2008 2011
- Search historical meteorological data for observations that meet your threshold conditions
Some data files have been compressed with the GNU gzip program.
The weekly status report and the weekly maintenance report also provide valuable station information.
Note that the payload types and the station locations occasionally change.