


![]() View the latest observations near Atlantic Tropical Storm Bertha and East Pacific Hurricane Fausto.
View the latest observations near Atlantic Tropical Storm Bertha and East Pacific Hurricane Fausto.
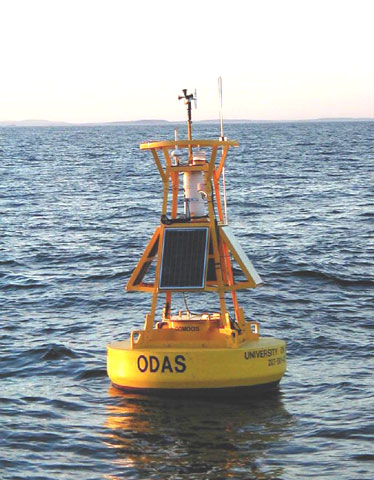
Station 44032 - Buoy E01 - Central Maine Shelf 
Owned and maintained by Northeastern Regional Association of Coastal Ocean Observing Systems
Moored Buoy
43.715 N 69.355 W (43°42'53" N 69°21'18" W)
Site elevation: sea level
Air temp height: 3 m above site elevation
Anemometer height: 4 m above site elevation
Barometer elevation: 3 m above mean sea level
Sea temp depth: 1 m below water line
Water depth: 100 m
Watch circle radius: 50 yards
(24 hours for tsunami stations)
|
Click on the graph icon in the table below to see a time series plot of the last five days of that observation. | |
| SSW ( 200 deg true ) | |
| 11.7 kts | |
| 13.6 kts | |
| 60.4 °F | |
| 0.0 nmi | |
| 11.7 kts | |
| 13.6 kts | |
| TIME (EDT) |
WDIR |
WSPD kts |
GST kts |
WVHT ft |
DPD sec |
APD sec |
MWD |
PRES in |
PTDY in |
ATMP °F |
WTMP °F |
DEWP °F |
SAL psu |
VIS nmi |
TIDE ft |
|---|---|---|---|---|---|---|---|---|---|---|---|---|---|---|---|
| 2026-07-20 11:50 pm | SSW | 11.7 | 13.6 | - | - | - | - | - | - | 60.6 | - | - | - | 0.0 | - |
| 2026-07-20 11:40 pm | SSW | 11.7 | 15.5 | - | - | - | - | - | - | 60.8 | - | - | 31.53 | 0.0 | - |
| 2026-07-20 11:30 pm | SSW | 11.7 | 13.6 | - | - | - | - | - | - | 61.0 | - | - | 31.53 | 0.0 | - |
| 2026-07-20 11:20 pm | SSW | 13.6 | 15.5 | - | - | - | - | - | - | 61.2 | - | - | 31.53 | 0.0 | - |
| 2026-07-20 11:10 pm | SSW | 13.6 | 15.5 | - | - | - | - | - | - | 61.5 | - | - | 31.51 | 0.0 | - |
| 2026-07-20 11:00 pm | SSW | 13.6 | 15.5 | - | - | - | - | - | - | 61.5 | - | - | 31.51 | 0.0 | - |
| 2026-07-20 10:50 pm | SSW | 13.6 | 15.5 | - | - | - | - | - | - | 61.3 | - | - | 31.51 | 0.0 | - |
| 2026-07-20 10:40 pm | SSW | 11.7 | 15.5 | - | - | - | - | - | - | 61.2 | - | - | 31.51 | 0.0 | - |
| 2026-07-20 10:30 pm | SSW | 11.7 | 13.6 | - | - | - | - | - | - | 61.2 | - | - | 31.51 | 0.0 | - |
| 2026-07-20 10:20 pm | SSW | 11.7 | 13.6 | - | - | - | - | - | - | 61.2 | - | - | 31.51 | 0.0 | - |
| 2026-07-20 10:10 pm | SSW | 11.7 | 13.6 | - | - | - | - | - | - | 61.2 | - | - | 31.50 | 0.0 | - |
| 2026-07-20 10:00 pm | - | - | - | 3.0 | 4 | - | - | - | - | - | - | - | 31.50 | - | - |
| 2026-07-20 09:50 pm | SSW | 11.7 | 13.6 | - | - | - | - | - | - | 61.2 | - | - | 31.50 | 0.0 | - |
| 2026-07-20 09:40 pm | SSW | 11.7 | 13.6 | - | - | - | - | - | - | 61.2 | - | - | 31.52 | 0.0 | - |
| 2026-07-20 09:30 pm | SSW | 11.7 | 15.5 | - | - | - | - | - | - | 61.0 | - | - | 31.52 | 0.0 | - |
| 2026-07-20 09:20 pm | SSW | 11.7 | 13.6 | - | - | - | - | - | - | 60.8 | - | - | 31.52 | 0.0 | - |
| 2026-07-20 09:10 pm | SSW | 11.7 | 13.6 | - | - | - | - | - | - | 61.0 | - | - | 31.55 | 0.0 | - |
| 2026-07-20 09:00 pm | - | - | - | - | - | - | - | - | - | - | 56.5 | - | 31.55 | - | - |
| 2026-07-20 08:50 pm | SSW | 13.6 | 15.5 | - | - | - | - | - | - | 61.5 | - | - | 31.55 | 0.0 | - |
| 2026-07-20 08:40 pm | SSW | 13.6 | 15.5 | - | - | - | - | - | - | 61.9 | - | - | 31.57 | 0.0 | - |
| 2026-07-20 08:30 pm | - | - | - | - | - | - | - | - | - | - | 56.7 | - | 31.57 | - | - |
| 2026-07-20 08:20 pm | SSW | 13.6 | 17.5 | - | - | - | - | - | - | 61.9 | - | - | 31.57 | 0.0 | - |
| 2026-07-20 08:10 pm | SSW | 15.5 | 17.5 | - | - | - | - | - | - | 62.1 | - | - | 31.56 | 0.0 | - |
| 2026-07-20 08:00 pm | SSW | 13.6 | 15.5 | - | - | - | - | - | - | 62.1 | - | - | 31.56 | 0.0 | - |
| 2026-07-20 07:50 pm | SSW | 13.6 | 17.5 | - | - | - | - | - | - | 62.2 | - | - | 31.56 | 0.0 | - |
| 2026-07-20 07:40 pm | SSW | 13.6 | 15.5 | - | - | - | - | - | - | 62.2 | - | - | 31.64 | 0.0 | - |
| 2026-07-20 07:30 pm | SSW | 13.6 | 17.5 | - | - | - | - | - | - | 62.2 | - | - | 31.64 | 0.0 | - |
| 2026-07-20 07:20 pm | SSW | 13.6 | 15.5 | - | - | - | - | - | - | 62.2 | - | - | 31.64 | 0.0 | - |
| 2026-07-20 07:10 pm | SSW | 13.6 | 15.5 | - | - | - | - | - | - | 62.2 | - | - | 31.65 | 0.0 | - |
| 2026-07-20 07:00 pm | SSW | 13.6 | 15.5 | - | - | - | - | - | - | 62.1 | - | - | 31.65 | 0.0 | - |
| 2026-07-20 06:50 pm | SSW | 13.6 | 15.5 | - | - | - | - | - | - | 62.2 | - | - | 31.65 | 0.0 | - |
| 2026-07-20 06:40 pm | SSW | 13.6 | 15.5 | - | - | - | - | - | - | 62.2 | - | - | 31.70 | 0.0 | - |
| 2026-07-20 06:30 pm | - | - | - | - | - | - | - | - | - | - | 57.7 | - | 31.70 | - | - |
| 2026-07-20 06:20 pm | SSW | 11.7 | 13.6 | - | - | - | - | - | - | 62.6 | - | - | 31.70 | 0.0 | - |
| 2026-07-20 06:10 pm | SSW | 13.6 | 15.5 | - | - | - | - | - | - | 63.3 | - | - | - | 0.0 | - |
| 2026-07-20 06:00 pm | SSW | 11.7 | 13.6 | 2.6 | 9 | - | - | - | - | 62.4 | 57.7 | - | - | 0.0 | - |
| 2026-07-20 05:50 pm | SSW | 11.7 | 13.6 | - | - | - | - | - | - | 62.8 | - | - | - | 0.0 | - |
| 2026-07-20 05:40 pm | SSW | 11.7 | 13.6 | - | - | - | - | - | - | 63.0 | - | - | - | 0.0 | - |
| 2026-07-20 05:30 pm | SSW | 11.7 | 15.5 | - | - | - | - | - | - | 62.6 | - | - | - | 0.0 | - |
| 2026-07-20 05:20 pm | SSW | 11.7 | 13.6 | - | - | - | - | - | - | 61.9 | - | - | - | 0.0 | - |
| 2026-07-20 05:10 pm | SSW | 11.7 | 13.6 | - | - | - | - | - | - | 62.4 | - | - | 31.71 | 0.0 | - |
| 2026-07-20 05:00 pm | SSW | 11.7 | 15.5 | 3.0 | 8 | - | - | - | - | 62.2 | 58.3 | - | 31.71 | 0.0 | - |
| 2026-07-20 04:50 pm | SSW | 11.7 | 13.6 | - | - | - | - | - | - | 61.9 | - | - | 31.71 | 0.0 | - |
| 2026-07-20 04:40 pm | SSW | 13.6 | 15.5 | - | - | - | - | - | - | 61.9 | - | - | - | 0.0 | - |
| 2026-07-20 04:30 pm | SSW | 13.6 | 15.5 | - | - | - | - | - | - | 61.9 | - | - | - | 0.0 | - |
| 2026-07-20 04:20 pm | SSW | 13.6 | 15.5 | - | - | - | - | - | - | 62.1 | - | - | - | 0.0 | - |
| 2026-07-20 04:10 pm | SSW | 13.6 | 15.5 | - | - | - | - | - | - | 62.1 | - | - | 31.69 | 0.0 | - |
| 2026-07-20 04:00 pm | SSW | 11.7 | 13.6 | 2.6 | 8 | - | - | - | - | 61.9 | 58.3 | - | 31.69 | 0.0 | - |
| 2026-07-20 03:50 pm | SSW | 11.7 | 15.5 | - | - | - | - | - | - | 61.7 | - | - | 31.69 | 0.0 | - |
| 2026-07-20 03:40 pm | SSW | 13.6 | 15.5 | - | - | - | - | - | - | 62.1 | - | - | - | 0.0 | - |
| 2026-07-20 03:30 pm | SSW | 11.7 | 15.5 | - | - | - | - | - | - | 61.9 | - | - | - | 0.0 | - |
| 2026-07-20 03:20 pm | SW | 13.6 | 15.5 | - | - | - | - | - | - | 62.1 | - | - | - | 0.0 | - |
| 2026-07-20 03:10 pm | SW | 11.7 | 15.5 | - | - | - | - | - | - | 61.7 | - | - | 31.66 | 0.0 | - |
| 2026-07-20 03:00 pm | SSW | 11.7 | 13.6 | 2.6 | 7 | - | - | - | - | 61.3 | 57.9 | - | 31.66 | 0.0 | - |
| 2026-07-20 02:50 pm | SSW | 11.7 | 13.6 | - | - | - | - | - | - | 61.3 | - | - | 31.66 | 0.0 | - |
| 2026-07-20 02:40 pm | SSW | 13.6 | 15.5 | - | - | - | - | - | - | 61.5 | - | - | - | 0.0 | - |
| 2026-07-20 02:30 pm | SSW | 13.6 | 17.5 | - | - | - | - | - | - | 62.1 | - | - | - | 0.0 | - |
| 2026-07-20 02:20 pm | SSW | 11.7 | 15.5 | - | - | - | - | - | - | 61.2 | - | - | - | 0.0 | - |
| 2026-07-20 02:10 pm | SSW | 11.7 | 13.6 | - | - | - | - | - | - | 61.2 | - | - | 31.67 | 0.0 | - |
| 2026-07-20 02:00 pm | SSW | 9.7 | 11.7 | 2.6 | 8 | - | - | - | - | 61.2 | 57.7 | - | 31.67 | 0.0 | - |
| 2026-07-20 01:50 pm | SSW | 9.7 | 11.7 | - | - | - | - | - | - | 60.8 | - | - | 31.67 | 0.0 | - |
| 2026-07-20 01:40 pm | SSW | 9.7 | 11.7 | - | - | - | - | - | - | 60.4 | - | - | 31.66 | 0.0 | - |
| 2026-07-20 01:30 pm | SSW | 9.7 | 11.7 | - | - | - | - | - | - | 60.3 | - | - | 31.66 | 0.0 | - |
| 2026-07-20 01:20 pm | SSW | 9.7 | 11.7 | - | - | - | - | - | - | 60.1 | - | - | 31.66 | 0.0 | - |
| 2026-07-20 01:10 pm | SSW | 9.7 | 9.7 | - | - | - | - | - | - | 60.3 | - | - | - | 0.0 | - |
| 2026-07-20 01:00 pm | SW | 7.8 | 11.7 | 2.3 | 8 | - | - | - | - | 60.1 | 57.6 | - | - | 0.0 | - |
| 2026-07-20 12:50 pm | SW | 7.8 | 7.8 | - | - | - | - | - | - | 59.7 | - | - | - | 0.0 | - |
| 2026-07-20 12:40 pm | SW | 7.8 | 9.7 | - | - | - | - | - | - | 59.7 | - | - | 31.62 | 0.0 | - |
| 2026-07-20 12:30 pm | SW | 9.7 | 11.7 | - | - | - | - | - | - | 59.4 | - | - | 31.62 | 0.0 | - |
| 2026-07-20 12:20 pm | SW | 9.7 | 11.7 | - | - | - | - | - | - | 59.2 | - | - | 31.62 | 0.0 | - |
| 2026-07-20 12:10 pm | SW | 9.7 | 11.7 | - | - | - | - | - | - | 59.4 | - | - | - | 0.0 | - |
| 2026-07-20 12:00 pm | SW | 11.7 | 11.7 | 2.6 | 8 | - | - | - | - | 59.5 | 57.0 | - | - | 0.0 | - |
| 2026-07-20 11:50 am | SW | 9.7 | 11.7 | - | - | - | - | - | - | 59.2 | - | - | - | 0.0 | - |
| 2026-07-20 11:40 am | SSW | 7.8 | 11.7 | - | - | - | - | - | - | 58.8 | - | - | 31.61 | 0.0 | - |
| 2026-07-20 11:30 am | SW | 7.8 | 9.7 | - | - | - | - | - | - | 58.8 | - | - | 31.61 | 0.0 | - |
| 2026-07-20 11:20 am | SW | 7.8 | 9.7 | - | - | - | - | - | - | 58.5 | - | - | 31.61 | 0.0 | - |
| 2026-07-20 11:10 am | SW | 7.8 | 9.7 | - | - | - | - | - | - | 58.3 | - | - | 31.60 | 0.0 | - |
| 2026-07-20 11:00 am | SW | 9.7 | 9.7 | - | - | - | - | - | - | 58.5 | - | - | 31.60 | 0.0 | - |
| 2026-07-20 10:50 am | SW | 7.8 | 9.7 | - | - | - | - | - | - | 58.5 | - | - | 31.60 | 0.0 | - |
| 2026-07-20 10:40 am | SW | 9.7 | 11.7 | - | - | - | - | - | - | 58.5 | - | - | 31.59 | 0.0 | - |
| 2026-07-20 10:30 am | SW | 9.7 | 11.7 | - | - | - | - | - | - | 57.9 | - | - | 31.59 | 0.0 | - |
| 2026-07-20 10:20 am | SW | 9.7 | 9.7 | - | - | - | - | - | - | 57.7 | - | - | 31.59 | 0.0 | - |
| 2026-07-20 10:10 am | WSW | 9.7 | 11.7 | - | - | - | - | - | - | 57.9 | - | - | - | 0.0 | - |
| 2026-07-20 10:00 am | SW | 9.7 | 11.7 | - | - | - | - | - | - | 57.7 | - | - | - | 0.0 | - |
| 2026-07-20 09:50 am | WSW | 9.7 | 11.7 | - | - | - | - | - | - | 57.6 | - | - | - | 0.0 | - |
| 2026-07-20 09:40 am | WSW | 9.7 | 11.7 | - | - | - | - | - | - | 57.6 | - | - | 31.53 | 0.0 | - |
| 2026-07-20 09:30 am | WSW | 9.7 | 11.7 | - | - | - | - | - | - | 57.7 | - | - | 31.53 | 0.0 | - |
| 2026-07-20 09:20 am | WSW | 7.8 | 9.7 | - | - | - | - | - | - | 57.7 | - | - | 31.53 | 0.0 | - |
| 2026-07-20 09:10 am | WSW | 7.8 | 9.7 | - | - | - | - | - | - | 57.4 | - | - | - | 0.0 | - |
| 2026-07-20 09:00 am | SW | 7.8 | 7.8 | 2.0 | 8 | - | - | - | - | 57.2 | 54.7 | - | - | 0.0 | - |
| 2026-07-20 08:50 am | SW | 7.8 | 7.8 | - | - | - | - | - | - | 57.4 | - | - | - | 0.0 | - |
| 2026-07-20 08:40 am | SSW | 3.9 | 5.8 | - | - | - | - | - | - | 57.7 | - | - | 31.44 | 0.0 | - |
| 2026-07-20 08:30 am | SSW | 3.9 | 5.8 | - | - | - | - | - | - | 57.6 | - | - | 31.44 | 0.0 | - |
| 2026-07-20 08:20 am | SSW | 3.9 | 3.9 | - | - | - | - | - | - | 57.6 | - | - | 31.44 | 0.0 | - |
| 2026-07-20 08:10 am | SW | 3.9 | 5.8 | - | - | - | - | - | - | 57.4 | - | - | - | 0.0 | - |
| 2026-07-20 08:00 am | SW | 3.9 | 3.9 | - | - | - | - | - | - | 57.7 | - | - | - | 0.0 | - |
| 2026-07-20 07:50 am | WSW | 3.9 | 3.9 | - | - | - | - | - | - | 57.2 | - | - | - | 0.0 | - |
| 2026-07-20 07:40 am | WSW | 3.9 | 5.8 | - | - | - | - | - | - | 57.4 | - | - | 31.47 | 0.0 | - |
| 2026-07-20 07:30 am | - | - | - | - | - | - | - | - | - | - | 54.0 | - | 31.47 | - | - |
| 2026-07-20 07:20 am | W | 3.9 | 5.8 | - | - | - | - | - | - | 57.9 | - | - | 31.47 | 0.0 | - |
| 2026-07-20 07:10 am | W | 3.9 | 5.8 | - | - | - | - | - | - | 58.1 | - | - | 31.48 | 0.0 | - |
| 2026-07-20 07:00 am | W | 5.8 | 7.8 | 2.0 | 8 | - | - | - | - | 58.8 | 54.0 | - | 31.48 | 0.0 | - |
| 2026-07-20 06:50 am | WSW | 7.8 | 7.8 | - | - | - | - | - | - | 58.5 | - | - | 31.48 | 0.0 | - |
| 2026-07-20 06:40 am | WSW | 5.8 | 7.8 | - | - | - | - | - | - | 57.6 | - | - | 31.48 | 0.0 | - |
| 2026-07-20 06:30 am | - | - | - | - | - | - | - | - | - | - | 54.1 | - | 31.48 | - | - |
| 2026-07-20 06:20 am | SW | 3.9 | 5.8 | - | - | - | - | - | - | 57.4 | - | - | 31.48 | 0.0 | - |
| 2026-07-20 06:10 am | WSW | 3.9 | 5.8 | - | - | - | - | - | - | 57.7 | - | - | - | 0.0 | - |
| 2026-07-20 06:00 am | WSW | 5.8 | 5.8 | - | - | - | - | - | - | 57.6 | - | - | - | 0.0 | - |
| 2026-07-20 05:50 am | WSW | 5.8 | 7.8 | - | - | - | - | - | - | 57.4 | - | - | - | 0.0 | - |
| 2026-07-20 05:40 am | WSW | 5.8 | 7.8 | - | - | - | - | - | - | 57.4 | - | - | 31.59 | 0.0 | - |
| 2026-07-20 05:30 am | WSW | 5.8 | 7.8 | - | - | - | - | - | - | 57.6 | - | - | 31.59 | 0.0 | - |
| 2026-07-20 05:20 am | WSW | 7.8 | 7.8 | - | - | - | - | - | - | 57.4 | - | - | 31.59 | 0.0 | - |
| 2026-07-20 05:10 am | W | 7.8 | 9.7 | - | - | - | - | - | - | 57.7 | - | - | - | 0.0 | - |
| 2026-07-20 05:00 am | W | 7.8 | 7.8 | 2.3 | 7 | - | - | - | - | 57.9 | 55.8 | - | - | 0.0 | - |
| 2026-07-20 04:50 am | W | 7.8 | 9.7 | - | - | - | - | - | - | 58.1 | - | - | - | 0.0 | - |
| 2026-07-20 04:40 am | W | 7.8 | 9.7 | - | - | - | - | - | - | 58.1 | - | - | 31.65 | 0.0 | - |
| 2026-07-20 04:30 am | W | 9.7 | 11.7 | - | - | - | - | - | - | 58.3 | - | - | 31.65 | 0.0 | - |
| 2026-07-20 04:20 am | W | 9.7 | 9.7 | - | - | - | - | - | - | 58.3 | - | - | 31.65 | 0.0 | - |
| 2026-07-20 04:10 am | W | 9.7 | 9.7 | - | - | - | - | - | - | 58.5 | - | - | - | 0.0 | - |
| 2026-07-20 04:00 am | W | 9.7 | 11.7 | 2.3 | 7 | - | - | - | - | 58.6 | 56.3 | - | - | 0.0 | - |
| 2026-07-20 03:50 am | W | 9.7 | 11.7 | - | - | - | - | - | - | 59.0 | - | - | - | 0.0 | - |
| 2026-07-20 03:40 am | W | 9.7 | 11.7 | - | - | - | - | - | - | 58.8 | - | - | 31.67 | 0.0 | - |
| 2026-07-20 03:30 am | W | 9.7 | 11.7 | - | - | - | - | - | - | 59.2 | - | - | 31.67 | 0.0 | - |
| 2026-07-20 03:20 am | W | 9.7 | 11.7 | - | - | - | - | - | - | 59.2 | - | - | 31.67 | 0.0 | - |
| 2026-07-20 03:10 am | W | 9.7 | 11.7 | - | - | - | - | - | - | 58.8 | - | - | - | 0.0 | - |
| 2026-07-20 03:00 am | W | 9.7 | 13.6 | 2.6 | 7 | - | - | - | - | 59.9 | 56.3 | - | - | 0.0 | - |
| 2026-07-20 02:50 am | W | 9.7 | 11.7 | - | - | - | - | - | - | 59.4 | - | - | - | 0.0 | - |
| 2026-07-20 02:40 am | W | 11.7 | 13.6 | - | - | - | - | - | - | 59.4 | - | - | 31.65 | 0.0 | - |
| 2026-07-20 02:30 am | W | 11.7 | 13.6 | - | - | - | - | - | - | 59.5 | - | - | 31.65 | 0.0 | - |
| 2026-07-20 02:20 am | W | 11.7 | 15.5 | - | - | - | - | - | - | 59.5 | - | - | 31.65 | 0.0 | - |
| 2026-07-20 02:10 am | W | 11.7 | 15.5 | - | - | - | - | - | - | 59.2 | - | - | - | 0.0 | - |
| 2026-07-20 02:00 am | - | - | - | 2.3 | 8 | - | - | - | - | - | - | - | - | - | - |
| 2026-07-20 01:50 am | W | 13.6 | 15.5 | - | - | - | - | - | - | 59.4 | - | - | - | 0.0 | - |
| 2026-07-20 01:40 am | W | 13.6 | 17.5 | - | - | - | - | - | - | 59.5 | - | - | 31.64 | 0.0 | - |
| 2026-07-20 01:30 am | - | - | - | - | - | - | - | - | - | - | 56.1 | - | 31.64 | - | - |
| 2026-07-20 01:20 am | W | 9.7 | 13.6 | - | - | - | - | - | - | 59.4 | - | - | 31.64 | 0.0 | - |
| 2026-07-20 01:10 am | WSW | 9.7 | 11.7 | - | - | - | - | - | - | 59.4 | - | - | 31.64 | 0.0 | - |
| 2026-07-20 01:00 am | - | - | - | 2.3 | 8 | - | - | - | - | - | - | - | 31.64 | - | - |
| 2026-07-20 12:50 am | W | 9.7 | 13.6 | - | - | - | - | - | - | 60.1 | - | - | 31.64 | 0.0 | - |
| 2026-07-20 12:40 am | W | 9.7 | 11.7 | - | - | - | - | - | - | 59.7 | - | - | - | 0.0 | - |
| 2026-07-20 12:30 am | W | 9.7 | 11.7 | - | - | - | - | - | - | 59.9 | - | - | - | 0.0 | - |
| 2026-07-20 12:20 am | W | 7.8 | 9.7 | - | - | - | - | - | - | 60.6 | - | - | - | 0.0 | - |
| 2026-07-20 12:10 am | W | 7.8 | 9.7 | - | - | - | - | - | - | 60.8 | - | - | 31.62 | 0.0 | - |
| 2026-07-20 12:00 am | W | 9.7 | 11.7 | 2.3 | 7 | - | - | - | - | 61.3 | 55.9 | - | 31.62 | 0.0 | - |
| 2026-07-19 11:50 pm | W | 11.7 | 13.6 | - | - | - | - | - | - | 62.2 | - | - | 31.62 | 0.0 | - |
Disclaimer: Ocean current directions are reported to the nearest 10 degrees and speeds are measured to the nearest whole centimeter per second.
Ocean Current Data for 44032
| 10:00 pm EDT | ||
|---|---|---|
| Depth ft | Dir ° | Speed kts |
| 7 | 120 | 0.31 |
Previous (up to 48) reports of ocean current data for 44032
Ocean Current Stick Plots are available in metric units only:
All Instruments -  1-day plot 3-day plot 5-day plot
|
These oceanographic data are displayed in rounded times. Click on the graph icon in the table below to see a time series plot of the last five days of that observation. | |
| Depth (DEPTH): | 3.3 ft |
| 56.14 °F | |
| 31.53 psu | |
| TIME (EDT) |
DEPTH ft |
OTMP °F |
COND mS/cm |
SAL psu |
O2% % |
O2PPM ppm |
CLCON ug/l |
TURB FTU |
PH |
EH mV |
|---|---|---|---|---|---|---|---|---|---|---|
| 2026-07-20 11:00 pm | 3.3 | 56.14 | - | 31.51 | - | - | - | - | - | - |
| 2026-07-20 10:30 pm | 3.3 | 56.21 | - | 31.51 | - | - | - | - | - | - |
| 2026-07-20 10:00 pm | 3.3 | 56.26 | - | 31.50 | - | - | - | - | - | - |
| 2026-07-20 09:30 pm | 3.3 | 56.16 | - | 31.52 | - | - | - | - | - | - |
| 2026-07-20 09:00 pm | 3.3 | 56.41 | - | 31.55 | - | - | - | - | - | - |
| 2026-07-20 08:30 pm | 3.3 | 56.61 | - | 31.57 | - | - | - | - | - | - |
| 2026-07-20 08:00 pm | 3.3 | 56.79 | - | 31.56 | - | - | - | - | - | - |
| 2026-07-20 07:30 pm | 3.3 | 57.51 | - | 31.64 | - | - | - | - | - | - |
| 2026-07-20 07:00 pm | 3.3 | 57.81 | - | 31.65 | - | - | - | - | - | - |
| 2026-07-20 06:30 pm | 3.3 | 57.76 | - | 31.70 | - | - | - | - | - | - |
| 2026-07-20 05:00 pm | 3.3 | 58.23 | - | 31.71 | - | - | - | - | - | - |
| 2026-07-20 04:00 pm | 3.3 | 58.28 | - | 31.69 | - | - | - | - | - | - |
| 2026-07-20 03:00 pm | 3.3 | 57.99 | - | 31.66 | - | - | - | - | - | - |
| 2026-07-20 02:00 pm | 3.3 | 57.65 | - | 31.67 | - | - | - | - | - | - |
| 2026-07-20 01:30 pm | 3.3 | 57.58 | - | 31.66 | - | - | - | - | - | - |
| 2026-07-20 12:30 pm | 3.3 | 57.24 | - | 31.62 | - | - | - | - | - | - |
| 2026-07-20 11:30 am | 3.3 | 56.73 | - | 31.61 | - | - | - | - | - | - |
| 2026-07-20 11:00 am | 3.3 | 56.52 | - | 31.60 | - | - | - | - | - | - |
| 2026-07-20 10:30 am | 3.3 | 56.32 | - | 31.59 | - | - | - | - | - | - |
| 2026-07-20 09:30 am | 3.3 | 55.35 | - | 31.53 | - | - | - | - | - | - |
| 2026-07-20 08:30 am | 3.3 | 54.16 | - | 31.44 | - | - | - | - | - | - |
| 2026-07-20 07:30 am | 3.3 | 53.94 | - | 31.47 | - | - | - | - | - | - |
| 2026-07-20 07:00 am | 3.3 | 53.91 | - | 31.48 | - | - | - | - | - | - |
| 2026-07-20 06:30 am | 3.3 | 54.10 | - | 31.48 | - | - | - | - | - | - |
| 2026-07-20 05:30 am | 3.3 | 55.42 | - | 31.59 | - | - | - | - | - | - |
| 2026-07-20 04:30 am | 3.3 | 55.96 | - | 31.65 | - | - | - | - | - | - |
| 2026-07-20 03:30 am | 3.3 | 56.41 | - | 31.67 | - | - | - | - | - | - |
| 2026-07-20 02:30 am | 3.3 | 56.21 | - | 31.65 | - | - | - | - | - | - |
| 2026-07-20 01:30 am | 3.3 | 56.10 | - | 31.64 | - | - | - | - | - | - |
| 2026-07-20 01:00 am | 3.3 | 56.05 | - | 31.64 | - | - | - | - | - | - |
| 2026-07-20 12:00 am | 3.3 | 55.90 | - | 31.62 | - | - | - | - | - | - |
Historical data for station 44032 are available at the NERACOOS website.