


Station 44008 (LLNR 827) - NANTUCKET 54 NM Southeast of Nantucket 
Nantucket Shoals LB "N"
Owned and maintained by National Data Buoy Center
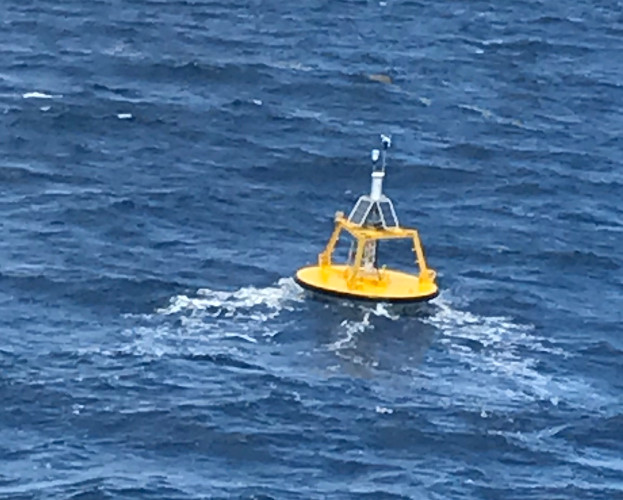
3-meter discus buoy
SCOOP payload
40.496 N 69.250 W (40°29'44" N 69°15'1" W)
Site elevation: sea level
Air temp height: 3.4 m above site elevation
Anemometer height: 3.8 m above site elevation
Barometer elevation: 2.4 m above mean sea level
Sea temp depth: 2 m below water line
Water depth: 72 m
Watch circle radius: 142 yards
Caution: Right whales may be active in northeast waters year-round. Mandatory speed restrictions of 10 knots apply to vessels 65 feet or greater in specific areas and times along the US east coast. Voluntary speed restrictions may be in effect in other areas and times. For current information on speed-restricted areas, go to: http://www.nmfs.noaa.gov/pr/shipstrike
(24 hours for tsunami stations)

|
Click on the graph icon in the table below to see a time series plot of the last five days of that observation. | |
| W ( 280 deg true ) | |
| 5.8 kts | |
| 7.8 kts | |
| 3.3 ft | |
| 9 sec | |
| 5.5 sec | |
| S ( 186 deg true ) | |
| 30.05 in | |
| 67.6 °F | |
| 5.8 kts | |
| 5.8 kts | |
|
|||||||||||||||
| TIME (EDT) |
WDIR |
WSPD kts |
GST kts |
WVHT ft |
DPD sec |
APD sec |
MWD |
PRES in |
PTDY in |
ATMP °F |
WTMP °F |
DEWP °F |
SAL psu |
VIS nmi |
TIDE ft |
|---|---|---|---|---|---|---|---|---|---|---|---|---|---|---|---|
| 2024-07-26 09:10 pm | WNW | 5.8 | 7.8 | 3.3 | - | 5.5 | S | 30.05 | - | - | 67.6 | - | - | - | - |
| 2024-07-26 09:00 pm | WNW | 5.8 | 7.8 | - | - | - | - | 30.04 | +0.03 | - | 67.5 | - | - | - | - |
| 2024-07-26 08:50 pm | W | 5.8 | 5.8 | 3.3 | 9 | 5.5 | S | 30.04 | - | - | 67.6 | - | - | - | - |
| 2024-07-26 08:40 pm | WNW | 5.8 | 7.8 | - | - | - | - | 30.04 | - | - | 67.6 | - | - | - | - |
| 2024-07-26 08:30 pm | W | 5.8 | 7.8 | - | - | - | - | 30.03 | - | - | 67.6 | - | - | - | - |
| 2024-07-26 08:20 pm | W | 5.8 | 7.8 | 3.6 | 9 | 5.5 | S | 30.03 | - | - | 67.6 | - | - | - | - |
| 2024-07-26 08:10 pm | WNW | 5.8 | 7.8 | 3.6 | - | 5.5 | S | 30.03 | - | - | 67.6 | - | - | - | - |
| 2024-07-26 08:00 pm | WNW | 5.8 | 7.8 | - | - | - | - | 30.02 | +0.01 | - | 67.6 | - | - | - | - |
| 2024-07-26 07:50 pm | WNW | 5.8 | 7.8 | 3.6 | 8 | 5.6 | S | 30.02 | - | - | 67.6 | - | - | - | - |
| 2024-07-26 07:40 pm | WNW | 5.8 | 7.8 | - | - | - | - | 30.03 | - | - | 67.8 | - | - | - | - |
| 2024-07-26 07:30 pm | WNW | 5.8 | 7.8 | - | - | - | - | 30.02 | - | - | 67.6 | - | - | - | - |
| 2024-07-26 07:10 pm | WNW | 5.8 | 7.8 | 3.6 | - | 5.5 | S | 30.02 | - | - | 67.8 | - | - | - | - |
| 2024-07-26 07:00 pm | WNW | 5.8 | 7.8 | - | - | - | - | 30.02 | +0.01 | - | 67.8 | - | - | - | - |
| 2024-07-26 06:50 pm | WNW | 5.8 | 7.8 | 3.6 | 8 | 5.1 | S | 30.02 | - | - | 67.8 | - | - | - | - |
| 2024-07-26 06:40 pm | WNW | 5.8 | 5.8 | - | - | - | - | 30.01 | - | - | 67.8 | - | - | - | - |
| 2024-07-26 06:30 pm | NW | 5.8 | 7.8 | - | - | - | - | 30.01 | - | - | 67.8 | - | - | - | - |
| 2024-07-26 06:20 pm | NW | 5.8 | 7.8 | 3.6 | 9 | 5.1 | S | 30.01 | - | - | 67.8 | - | - | - | - |
| 2024-07-26 06:10 pm | NW | 5.8 | 7.8 | 3.6 | - | 5.1 | S | 30.01 | - | - | 67.8 | - | - | - | - |
| 2024-07-26 06:00 pm | NW | 5.8 | 7.8 | - | - | - | - | 30.01 | +0.00 | - | 67.8 | - | - | - | - |
| 2024-07-26 05:50 pm | NW | 5.8 | 7.8 | 3.6 | 8 | 4.9 | S | 30.01 | - | - | 67.8 | - | - | - | - |
| 2024-07-26 05:40 pm | NW | 7.8 | 7.8 | - | - | - | - | 30.01 | - | - | 67.6 | - | - | - | - |
| 2024-07-26 05:30 pm | NW | 7.8 | 7.8 | - | - | - | - | 30.01 | - | - | - | - | - | - | - |
| 2024-07-26 05:20 pm | WNW | 7.8 | 7.8 | 3.9 | 9 | 5.0 | S | 30.01 | - | - | 67.5 | - | - | - | - |
| 2024-07-26 05:10 pm | WNW | 7.8 | 9.7 | - | - | - | - | 30.01 | - | - | 67.5 | - | - | - | - |
| 2024-07-26 05:00 pm | WNW | 7.8 | 9.7 | - | - | - | - | 30.01 | +0.00 | - | 67.3 | - | - | - | - |
| 2024-07-26 04:50 pm | WNW | 7.8 | 9.7 | 3.9 | 5 | 4.9 | W | 30.01 | - | - | 67.3 | - | - | - | - |
| 2024-07-26 04:40 pm | WNW | 7.8 | 9.7 | 3.9 | - | 4.9 | W | 30.01 | - | - | 67.1 | - | - | - | - |
| 2024-07-26 04:30 pm | WNW | 7.8 | 9.7 | - | - | - | - | 30.01 | - | - | 67.1 | - | - | - | - |
| 2024-07-26 04:20 pm | WNW | 7.8 | 9.7 | 3.9 | 9 | 5.1 | S | 30.01 | - | - | 67.1 | - | - | - | - |
| 2024-07-26 04:10 pm | WNW | 7.8 | 9.7 | 3.9 | - | 5.1 | S | 30.01 | - | - | 67.1 | - | - | - | - |
| 2024-07-26 04:00 pm | WNW | 7.8 | 9.7 | - | - | - | - | 30.01 | +0.00 | - | 66.9 | - | - | - | - |
| 2024-07-26 03:50 pm | WNW | 7.8 | 9.7 | 3.9 | 8 | 4.9 | SSW | 30.01 | - | - | 66.9 | - | - | - | - |
| 2024-07-26 03:40 pm | WNW | 7.8 | 9.7 | 3.9 | - | 4.9 | SSW | 30.01 | - | - | 66.9 | - | - | - | - |
| 2024-07-26 03:30 pm | WNW | 7.8 | 11.7 | - | - | - | - | 30.00 | - | - | 66.9 | - | - | - | - |
| 2024-07-26 03:20 pm | WNW | 7.8 | 11.7 | 3.9 | 6 | 4.9 | WSW | 30.01 | - | - | - | - | - | - | - |
| 2024-07-26 03:10 pm | WNW | 9.7 | 11.7 | 3.9 | - | 4.9 | WSW | 30.01 | - | - | 66.9 | - | - | - | - |
| 2024-07-26 03:00 pm | WNW | 9.7 | 11.7 | - | - | - | - | 30.01 | +0.00 | - | 66.9 | - | - | - | - |
| 2024-07-26 02:50 pm | WNW | 9.7 | 11.7 | 3.9 | 8 | 5.0 | S | 30.01 | - | - | 66.9 | - | - | - | - |
| 2024-07-26 02:40 pm | WNW | 9.7 | 11.7 | - | - | - | - | 30.01 | - | - | 66.7 | - | - | - | - |
| 2024-07-26 02:30 pm | WNW | 9.7 | 13.6 | - | - | - | - | 30.01 | - | - | 66.9 | - | - | - | - |
| 2024-07-26 02:20 pm | WNW | 11.7 | 13.6 | 4.3 | 8 | 5.1 | SSW | 30.01 | - | - | 66.9 | - | - | - | - |
| 2024-07-26 02:10 pm | WNW | 9.7 | 13.6 | 4.3 | - | 5.1 | SSW | 30.01 | - | - | 67.1 | - | - | - | - |
| 2024-07-26 02:00 pm | WNW | 9.7 | 11.7 | - | - | - | - | 30.01 | +0.00 | - | 66.9 | - | - | - | - |
| 2024-07-26 01:50 pm | WNW | 9.7 | 13.6 | 4.3 | 8 | 5.2 | S | 30.01 | - | - | 67.1 | - | - | - | - |
| 2024-07-26 01:40 pm | WNW | 9.7 | 11.7 | - | - | - | - | 30.00 | - | - | 67.1 | - | - | - | - |
| 2024-07-26 01:30 pm | WNW | 9.7 | 11.7 | - | - | - | - | 30.01 | - | - | 67.1 | - | - | - | - |
| 2024-07-26 01:20 pm | WNW | 9.7 | 11.7 | 4.3 | 7 | 5.4 | S | 30.01 | - | - | 67.3 | - | - | - | - |
| 2024-07-26 01:10 pm | WNW | 9.7 | 11.7 | 4.3 | - | 5.4 | S | 30.01 | - | - | 67.3 | - | - | - | - |
| 2024-07-26 01:00 pm | WNW | 9.7 | 11.7 | - | - | - | - | 30.01 | +0.00 | - | 67.3 | - | - | - | - |
| 2024-07-26 12:50 pm | WNW | 9.7 | 13.6 | 4.6 | 8 | 5.5 | S | 30.00 | - | - | 67.1 | - | - | - | - |
| 2024-07-26 12:40 pm | WNW | 9.7 | 11.7 | - | - | - | - | 30.01 | - | - | 67.1 | - | - | - | - |
| 2024-07-26 12:30 pm | WNW | 9.7 | 13.6 | - | - | - | - | 30.01 | - | - | 67.1 | - | - | - | - |
| 2024-07-26 12:20 pm | WNW | 11.7 | 13.6 | 4.9 | 8 | 5.5 | SSW | 30.01 | - | - | 67.1 | - | - | - | - |
| 2024-07-26 12:10 pm | WNW | 11.7 | 13.6 | 4.9 | - | 5.5 | SSW | 30.01 | - | - | 67.5 | - | - | - | - |
| 2024-07-26 12:00 pm | WNW | 11.7 | 13.6 | - | - | - | - | 30.01 | +0.00 | - | 67.6 | - | - | - | - |
| 2024-07-26 11:50 am | WNW | 11.7 | 13.6 | 4.9 | 8 | 5.7 | S | 30.01 | - | - | 67.6 | - | - | - | - |
| 2024-07-26 11:40 am | WNW | 11.7 | 13.6 | - | - | - | - | 30.01 | - | - | 67.8 | - | - | - | - |
| 2024-07-26 11:30 am | WNW | 11.7 | 13.6 | - | - | - | - | 30.01 | - | - | 67.6 | - | - | - | - |
| 2024-07-26 11:20 am | WNW | 11.7 | 13.6 | 4.6 | 7 | 5.6 | SSW | 30.01 | - | - | 67.8 | - | - | - | - |
| 2024-07-26 11:10 am | WNW | 11.7 | 15.5 | - | - | - | - | 30.01 | - | - | 67.8 | - | - | - | - |
| 2024-07-26 11:00 am | WNW | 11.7 | 15.5 | - | - | - | - | 30.01 | +0.01 | - | 68.2 | - | - | - | - |
| 2024-07-26 10:50 am | WNW | 11.7 | 15.5 | 4.9 | 8 | 5.9 | S | 30.01 | - | - | 68.4 | - | - | - | - |
| 2024-07-26 10:40 am | WNW | 11.7 | 13.6 | - | - | - | - | 30.01 | - | - | 68.5 | - | - | - | - |
| 2024-07-26 10:30 am | W | 11.7 | 13.6 | - | - | - | - | 30.01 | - | - | 68.5 | - | - | - | - |
| 2024-07-26 10:20 am | W | 11.7 | 15.5 | 5.2 | 7 | 6.2 | SSW | 30.01 | - | - | 68.4 | - | - | - | - |
| 2024-07-26 10:10 am | W | 11.7 | 13.6 | 5.2 | - | 6.2 | SSW | 30.01 | - | - | 68.4 | - | - | - | - |
| 2024-07-26 10:00 am | W | 11.7 | 13.6 | - | - | - | - | 30.01 | +0.01 | - | 68.5 | - | - | - | - |
| 2024-07-26 09:50 am | WNW | 11.7 | 13.6 | 4.6 | 7 | 6.0 | SSW | 30.01 | - | - | 68.5 | - | - | - | - |
| 2024-07-26 09:40 am | WNW | 11.7 | 15.5 | - | - | - | - | 30.01 | - | - | 68.7 | - | - | - | - |
| 2024-07-26 09:30 am | WNW | 11.7 | 13.6 | - | - | - | - | 30.01 | - | - | 68.7 | - | - | - | - |
| 2024-07-26 09:20 am | WNW | 11.7 | 13.6 | 3.9 | 8 | 6.0 | SSW | 30.01 | - | - | 68.7 | - | - | - | - |
| 2024-07-26 09:10 am | WNW | 11.7 | 15.5 | 3.9 | - | 6.0 | SSW | 30.01 | - | - | 68.7 | - | - | - | - |
| 2024-07-26 09:00 am | WNW | 11.7 | 13.6 | - | - | - | - | 30.01 | +0.02 | - | 68.7 | - | - | - | - |
| 2024-07-26 08:50 am | WNW | 9.7 | 13.6 | 4.3 | 8 | 6.1 | SSW | 30.01 | - | - | 68.9 | - | - | - | - |
| 2024-07-26 08:40 am | WNW | 9.7 | 13.6 | - | - | - | - | 30.01 | - | - | 68.7 | - | - | - | - |
| 2024-07-26 08:30 am | W | 7.8 | 11.7 | - | - | - | - | 30.00 | - | - | 68.7 | - | - | - | - |
| 2024-07-26 08:20 am | WNW | 9.7 | 11.7 | 4.3 | 8 | 6.3 | S | 30.01 | - | - | 68.7 | - | - | - | - |
| 2024-07-26 08:10 am | W | 7.8 | 9.7 | 4.3 | - | 6.3 | S | 30.00 | - | - | 68.9 | - | - | - | - |
| 2024-07-26 08:00 am | W | 9.7 | 11.7 | - | - | - | - | 30.01 | +0.03 | - | 68.7 | - | - | - | - |
| 2024-07-26 07:50 am | WNW | 9.7 | 13.6 | 4.3 | 8 | 6.1 | SSW | 30.00 | - | - | 68.7 | - | - | - | - |
| 2024-07-26 07:40 am | WNW | 9.7 | 11.7 | - | - | - | - | 30.00 | - | - | 68.5 | - | - | - | - |
| 2024-07-26 07:30 am | WNW | 9.7 | 11.7 | - | - | - | - | 30.00 | - | - | 68.5 | - | - | - | - |
| 2024-07-26 07:20 am | WNW | 9.7 | 11.7 | 4.3 | 8 | 6.2 | SSW | 30.00 | - | - | 68.5 | - | - | - | - |
| 2024-07-26 07:10 am | WNW | 9.7 | 11.7 | 4.3 | - | 6.2 | SSW | 30.00 | - | - | 68.7 | - | - | - | - |
| 2024-07-26 07:00 am | WNW | 7.8 | 9.7 | - | - | - | - | 30.00 | +0.03 | - | 68.9 | - | - | - | - |
| 2024-07-26 06:50 am | WNW | 7.8 | 9.7 | 4.3 | 8 | 6.2 | SSW | 30.00 | - | - | 69.1 | - | - | - | - |
| 2024-07-26 06:40 am | WNW | 7.8 | 9.7 | 4.3 | - | 6.2 | SSW | 29.99 | - | - | 69.1 | - | - | - | - |
| 2024-07-26 06:30 am | WNW | 7.8 | 9.7 | - | - | - | - | 29.99 | - | - | 68.9 | - | - | - | - |
| 2024-07-26 06:20 am | WNW | 7.8 | 9.7 | 4.3 | 8 | 6.1 | S | 29.99 | - | - | - | - | - | - | - |
| 2024-07-26 06:10 am | W | 7.8 | 9.7 | 4.3 | - | 6.1 | S | 29.99 | - | - | 68.9 | - | - | - | - |
| 2024-07-26 06:00 am | WNW | 9.7 | 11.7 | - | - | - | - | 29.98 | +0.02 | - | 68.9 | - | - | - | - |
| 2024-07-26 05:50 am | WNW | 9.7 | 11.7 | 4.3 | 8 | 6.0 | S | 29.98 | - | - | 68.5 | - | - | - | - |
| 2024-07-26 05:40 am | W | 9.7 | 11.7 | - | - | - | - | 29.99 | - | - | 68.5 | - | - | - | - |
| 2024-07-26 05:30 am | WNW | 9.7 | 11.7 | - | - | - | - | 29.98 | - | - | 68.7 | - | - | - | - |
| 2024-07-26 05:20 am | WNW | 9.7 | 11.7 | 3.9 | 8 | 5.8 | S | 29.98 | - | - | 68.9 | - | - | - | - |
| 2024-07-26 05:10 am | WNW | 9.7 | 13.6 | 3.9 | - | 5.8 | S | 29.98 | - | - | 69.3 | - | - | - | - |
| 2024-07-26 05:00 am | WNW | 9.7 | 11.7 | - | - | - | - | 29.98 | +0.02 | - | 69.4 | - | - | - | - |
| 2024-07-26 04:50 am | WNW | 9.7 | 11.7 | 3.9 | 8 | 5.6 | S | 29.98 | - | - | 69.4 | - | - | - | - |
| 2024-07-26 04:40 am | WNW | 11.7 | 13.6 | - | - | - | - | 29.98 | - | - | 69.6 | - | - | - | - |
| 2024-07-26 04:30 am | WNW | 11.7 | 13.6 | - | - | - | - | 29.97 | - | - | 69.6 | - | - | - | - |
| 2024-07-26 04:20 am | WNW | 11.7 | 13.6 | 4.3 | 8 | 5.7 | S | 29.97 | - | - | 69.8 | - | - | - | - |
| 2024-07-26 04:10 am | WNW | 11.7 | 15.5 | - | - | - | - | 29.97 | - | - | 70.0 | - | - | - | - |
| 2024-07-26 04:00 am | WNW | 11.7 | 15.5 | - | - | - | - | 29.97 | +0.00 | - | 70.0 | - | - | - | - |
| 2024-07-26 03:50 am | WNW | 11.7 | 15.5 | 3.9 | 9 | 5.3 | S | 29.97 | - | - | 70.2 | - | - | - | - |
| 2024-07-26 03:40 am | WNW | 13.6 | 15.5 | - | - | - | - | 29.96 | - | - | 70.2 | - | - | - | - |
| 2024-07-26 03:30 am | WNW | 13.6 | 15.5 | - | - | - | - | 29.96 | - | - | 70.0 | - | - | - | - |
| 2024-07-26 03:20 am | WNW | 13.6 | 17.5 | 3.9 | - | 5.2 | S | 29.96 | - | - | - | - | - | - | - |
| 2024-07-26 03:10 am | - | - | - | 3.9 | 9 | - | - | - | - | - | 70.2 | - | - | - | - |
| 2024-07-26 03:00 am | WNW | 13.6 | 15.5 | - | - | - | - | 29.96 | +0.00 | - | 70.0 | - | - | - | - |
| 2024-07-26 02:50 am | WNW | 13.6 | 17.5 | 4.3 | 8 | 5.3 | S | 29.96 | - | - | 70.0 | - | - | - | - |
| 2024-07-26 02:40 am | WNW | 13.6 | 15.5 | - | - | - | - | 29.96 | - | - | 70.0 | - | - | - | - |
| 2024-07-26 02:30 am | WNW | 13.6 | 17.5 | - | - | - | - | 29.96 | - | - | 70.0 | - | - | - | - |
| 2024-07-26 02:20 am | WNW | 13.6 | 17.5 | 3.6 | 8 | 4.9 | S | 29.96 | - | - | 70.2 | - | - | - | - |
| 2024-07-26 02:10 am | WNW | 13.6 | 15.5 | 3.6 | - | 4.9 | S | 29.96 | - | - | 70.0 | - | - | - | - |
| 2024-07-26 02:00 am | WNW | 13.6 | 15.5 | - | - | - | - | 29.96 | -0.01 | - | 70.0 | - | - | - | - |
| 2024-07-26 01:50 am | W | 13.6 | 15.5 | 3.6 | 5 | 4.7 | SW | 29.96 | - | - | 70.0 | - | - | - | - |
| 2024-07-26 01:40 am | W | 13.6 | 15.5 | - | - | - | - | 29.96 | - | - | 70.0 | - | - | - | - |
| 2024-07-26 01:30 am | W | 11.7 | 15.5 | - | - | - | - | 29.96 | - | - | 70.0 | - | - | - | - |
| 2024-07-26 01:20 am | W | 11.7 | 13.6 | 4.3 | 6 | 5.0 | SW | 29.96 | - | - | 70.0 | - | - | - | - |
| 2024-07-26 01:10 am | W | 13.6 | 15.5 | 4.3 | - | 5.0 | SW | 29.96 | - | - | 70.0 | - | - | - | - |
| 2024-07-26 01:00 am | WSW | 11.7 | 15.5 | - | - | - | - | 29.96 | -0.02 | - | 70.0 | - | - | - | - |
| 2024-07-26 12:50 am | WSW | 11.7 | 13.6 | 3.9 | 8 | 5.1 | S | 29.96 | - | - | 69.4 | - | - | - | - |
| 2024-07-26 12:40 am | WSW | 13.6 | 15.5 | - | - | - | - | 29.96 | - | - | 69.4 | - | - | - | - |
| 2024-07-26 12:30 am | WSW | 13.6 | 15.5 | - | - | - | - | 29.97 | - | - | 69.4 | - | - | - | - |
| 2024-07-26 12:20 am | WSW | 13.6 | 15.5 | 4.3 | 5 | 4.8 | SW | 29.96 | - | - | 69.4 | - | - | - | - |
| 2024-07-26 12:10 am | WSW | 11.7 | 13.6 | 4.3 | - | 4.8 | SW | 29.96 | - | - | 69.4 | - | - | - | - |
| 2024-07-26 12:00 am | WSW | 11.7 | 15.5 | - | - | - | - | 29.96 | -0.01 | - | 69.4 | - | - | - | - |
| 2024-07-25 11:50 pm | WSW | 11.7 | 13.6 | 4.3 | 9 | 4.8 | S | 29.96 | - | - | 69.4 | - | - | - | - |
| 2024-07-25 11:40 pm | WSW | 11.7 | 13.6 | 4.3 | - | 4.8 | S | 29.97 | - | - | 69.4 | - | - | - | - |
| 2024-07-25 11:30 pm | WSW | 11.7 | 13.6 | - | - | - | - | 29.97 | - | - | 69.4 | - | - | - | - |
| 2024-07-25 11:20 pm | WSW | 11.7 | 15.5 | 4.3 | 9 | 4.8 | SSW | 29.97 | - | - | 69.4 | - | - | - | - |
| 2024-07-25 11:10 pm | WSW | 13.6 | 15.5 | 4.3 | - | 4.8 | SSW | 29.97 | - | - | 69.4 | - | - | - | - |
| 2024-07-25 11:00 pm | WSW | 11.7 | 15.5 | - | - | - | - | 29.97 | +0.00 | - | 69.4 | - | - | - | - |
| 2024-07-25 10:50 pm | WSW | 11.7 | 13.6 | 4.3 | 9 | 5.0 | S | 29.98 | - | - | 69.6 | - | - | - | - |
| 2024-07-25 10:40 pm | SW | 11.7 | 13.6 | 4.3 | - | 5.0 | S | 29.98 | - | - | 69.6 | - | - | - | - |
| 2024-07-25 10:30 pm | SW | 11.7 | 15.5 | - | - | - | - | 29.98 | - | - | 69.8 | - | - | - | - |
| 2024-07-25 10:20 pm | SW | 11.7 | 15.5 | 4.6 | 6 | 5.0 | SW | 29.98 | - | - | 70.0 | - | - | - | - |
| 2024-07-25 10:10 pm | SW | 11.7 | 15.5 | 4.6 | - | 5.0 | SW | 29.98 | - | - | 70.2 | - | - | - | - |
| 2024-07-25 10:00 pm | SW | 11.7 | 13.6 | - | - | - | - | 29.98 | +0.02 | - | 70.2 | - | - | - | - |
| 2024-07-25 09:50 pm | SW | 11.7 | 13.6 | 4.6 | 6 | 5.1 | SSW | 29.98 | - | - | 70.0 | - | - | - | - |
| 2024-07-25 09:40 pm | WSW | 11.7 | 13.6 | - | - | - | - | 29.98 | - | - | 70.0 | - | - | - | - |
| 2024-07-25 09:30 pm | WSW | 11.7 | 15.5 | - | - | - | - | 29.98 | - | - | 70.0 | - | - | - | - |
| 2024-07-25 09:20 pm | SW | 11.7 | 15.5 | 4.6 | 7 | 5.2 | S | 29.98 | - | - | 70.2 | - | - | - | - |
| 2024-07-25 09:10 pm | WSW | 13.6 | 17.5 | 4.6 | - | 5.2 | S | 29.98 | - | - | 70.2 | - | - | - | - |
| 2024-07-25 09:00 pm | SW | 11.7 | 15.5 | - | - | - | - | 29.98 | +0.03 | - | 70.3 | - | - | - | - |
| 2024-07-25 08:50 pm | SW | 11.7 | 13.6 | 5.2 | 7 | 5.4 | S | 29.98 | - | - | 70.3 | - | - | - | - |
|
These wave data are displayed in rounded times. Click on the graph icon in the table below to see a time series plot of the last five days of that observation. | |
| 3.3 ft | |
| 3.0 ft | |
| 9.1 sec | |
| S | |
| 1.3 ft | |
| 4.0 sec | |
| NW | |
| SWELL | |
| 5.5 sec | |
| TIME (EDT) |
WVHT ft |
SwH ft |
SwP sec |
SwD |
WWH ft |
WWP sec |
WWD |
STEEPNESS |
APD sec |
|---|---|---|---|---|---|---|---|---|---|
| 2024-07-26 08:40 pm | 3.3 | 3.3 | 9.1 | S | 1.3 | 3.7 | NNW | SWELL | 5.5 |
| 2024-07-26 08:10 pm | 3.6 | 3.3 | 9.1 | S | 1.3 | 3.7 | NW | SWELL | 5.5 |
| 2024-07-26 07:40 pm | 3.6 | 3.6 | 8.3 | S | 1.3 | 4.0 | WNW | AVERAGE | 5.6 |
| 2024-07-26 07:10 pm | 3.6 | 3.3 | 9.1 | S | 1.3 | 4.0 | WNW | SWELL | 5.5 |
| 2024-07-26 06:40 pm | 3.6 | 3.3 | 8.3 | S | 1.3 | 4.0 | WNW | AVERAGE | 5.1 |
| 2024-07-26 06:10 pm | 3.6 | 3.3 | 9.1 | S | 1.6 | 3.8 | WNW | SWELL | 5.1 |
| 2024-07-26 05:40 pm | 3.6 | 3.3 | 8.3 | S | 1.6 | 4.0 | WNW | AVERAGE | 4.9 |
| 2024-07-26 05:10 pm | 3.9 | 3.6 | 9.1 | S | 1.6 | 3.7 | WNW | SWELL | 5.0 |
| 2024-07-26 04:40 pm | 3.9 | 3.6 | 5.0 | W | 1.6 | 4.0 | WNW | VERY_STEEP | 4.9 |
| 2024-07-26 04:10 pm | 3.9 | 3.6 | 9.1 | S | 1.6 | 3.6 | W | SWELL | 5.1 |
| 2024-07-26 03:40 pm | 3.9 | 3.6 | 7.7 | SSW | 1.6 | 4.0 | W | AVERAGE | 4.9 |
| 2024-07-26 03:10 pm | 3.9 | 3.3 | 5.9 | WSW | 2.0 | 3.4 | W | STEEP | 4.9 |
| 2024-07-26 02:40 pm | 3.9 | 3.3 | 7.7 | S | 2.0 | 4.3 | SW | AVERAGE | 5.0 |
| 2024-07-26 02:10 pm | 4.3 | 3.6 | 8.3 | SSW | 2.6 | 4.2 | WSW | AVERAGE | 5.1 |
| 2024-07-26 01:40 pm | 4.3 | 3.6 | 8.3 | S | 2.3 | 5.0 | WSW | AVERAGE | 5.2 |
| 2024-07-26 01:10 pm | 4.3 | 3.9 | 7.1 | S | 2.0 | 4.5 | SW | STEEP | 5.4 |
| 2024-07-26 12:40 pm | 4.6 | 4.3 | 7.7 | S | 2.0 | 3.7 | WSW | AVERAGE | 5.5 |
| 2024-07-26 12:10 pm | 4.9 | 3.9 | 7.7 | SSW | 3.0 | 5.3 | SSW | AVERAGE | 5.5 |
| 2024-07-26 11:40 am | 4.9 | 4.3 | 7.7 | S | 2.3 | 5.0 | SW | AVERAGE | 5.7 |
| 2024-07-26 11:10 am | 4.6 | 3.3 | 7.1 | SSW | 3.0 | 5.9 | SSW | STEEP | 5.6 |
| 2024-07-26 10:40 am | 4.9 | 4.3 | 7.7 | S | 2.3 | 4.8 | SSW | AVERAGE | 5.9 |
| 2024-07-26 10:10 am | 5.2 | 4.9 | 6.7 | SSW | 2.3 | 5.0 | SW | STEEP | 6.2 |
| 2024-07-26 09:40 am | 4.6 | 3.9 | 7.1 | SSW | 2.6 | 5.0 | WSW | STEEP | 6.0 |
| 2024-07-26 09:10 am | 3.9 | 3.6 | 7.7 | SSW | 1.6 | 4.8 | SW | AVERAGE | 6.0 |
| 2024-07-26 08:40 am | 4.3 | 3.9 | 7.7 | SSW | 1.3 | 4.0 | W | AVERAGE | 6.1 |
| 2024-07-26 08:10 am | 4.3 | 4.3 | 7.7 | S | 1.0 | 3.7 | W | AVERAGE | 6.3 |
| 2024-07-26 07:40 am | 4.3 | 3.9 | 7.7 | SSW | 1.6 | 5.0 | WSW | AVERAGE | 6.1 |
| 2024-07-26 07:10 am | 4.3 | 3.9 | 8.3 | SSW | 1.3 | 3.8 | W | AVERAGE | 6.2 |
| 2024-07-26 06:40 am | 4.3 | 4.3 | 8.3 | SSW | 1.0 | 3.4 | W | AVERAGE | 6.2 |
| 2024-07-26 06:10 am | 4.3 | 3.9 | 7.7 | S | 1.0 | 3.6 | WNW | AVERAGE | 6.1 |
| 2024-07-26 05:40 am | 4.3 | 3.9 | 7.7 | S | 1.3 | 4.2 | W | AVERAGE | 6.0 |
| 2024-07-26 05:10 am | 3.9 | 3.6 | 8.3 | S | 1.6 | 4.8 | W | AVERAGE | 5.8 |
| 2024-07-26 04:40 am | 3.9 | 3.3 | 8.3 | S | 2.0 | 3.8 | W | AVERAGE | 5.6 |
| 2024-07-26 04:10 am | 4.3 | 3.6 | 8.3 | S | 2.3 | 5.9 | SW | AVERAGE | 5.7 |
| 2024-07-26 03:40 am | 3.9 | 3.0 | 9.1 | S | 2.6 | 5.6 | SW | SWELL | 5.3 |
| 2024-07-26 03:10 am | 3.9 | 2.6 | 9.1 | S | 3.0 | 6.2 | SW | AVERAGE | 5.2 |
| 2024-07-26 02:40 am | 4.3 | 2.6 | 8.3 | S | 3.0 | 5.9 | SW | AVERAGE | 5.3 |
| 2024-07-26 02:10 am | 3.6 | 2.3 | 8.3 | S | 3.0 | 5.3 | SW | AVERAGE | 4.9 |
| 2024-07-26 01:40 am | 3.6 | 2.0 | 7.7 | SSW | 3.0 | 5.3 | SW | VERY_STEEP | 4.7 |
| 2024-07-26 01:10 am | 4.3 | 2.6 | 9.1 | SSW | 3.3 | 5.9 | SW | STEEP | 5.0 |
| 2024-07-26 12:40 am | 3.9 | 2.6 | 8.3 | S | 3.0 | 5.0 | SSW | AVERAGE | 5.1 |
| 2024-07-26 12:10 am | 4.3 | 2.6 | 9.1 | SSW | 3.3 | 5.3 | SW | VERY_STEEP | 4.8 |
| 2024-07-25 11:40 pm | 4.3 | 2.6 | 9.1 | S | 3.3 | 4.8 | SW | AVERAGE | 4.8 |
| 2024-07-25 11:10 pm | 4.3 | 2.6 | 9.1 | SSW | 3.3 | 5.0 | SSW | AVERAGE | 4.8 |
| 2024-07-25 10:40 pm | 4.3 | 3.0 | 9.1 | S | 3.3 | 5.6 | SSW | AVERAGE | 5.0 |
| 2024-07-25 10:10 pm | 4.6 | 3.0 | 7.7 | S | 3.6 | 5.6 | SW | VERY_STEEP | 5.0 |
| 2024-07-25 09:40 pm | 4.6 | 3.6 | 5.9 | SSW | 3.0 | 5.3 | S | STEEP | 5.1 |
| 2024-07-25 09:10 pm | 4.6 | 3.0 | 6.7 | S | 3.6 | 5.6 | SSW | STEEP | 5.2 |
Links which are specific to this station are listed below:
Real Time Data in tabular form for the last forty-five days.
Historical Data & Climatic Summaries for quality controlled data for prior months and years.
The weekly status report and the weekly maintenance report also provide valuable station information.
Note that the payload types and the station locations occasionally change.