


Station 42013 - C10 - WFS Central Buoy, 25m Isobath 
Owned and maintained by COMPS (University of South Florida)
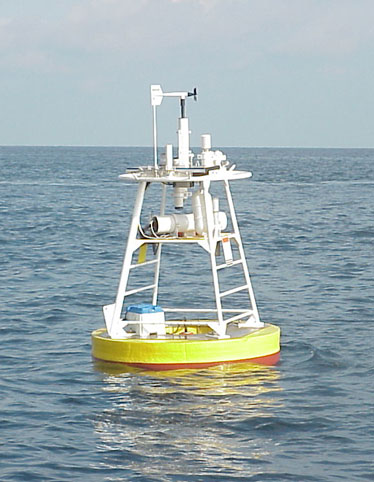
Offshore Buoy
27.173 N 82.924 W (27°10'23" N 82°55'26" W)
Site elevation: sea level
Air temp height: 2 m above site elevation
Anemometer height: 3.1 m above site elevation
Barometer elevation: 1.9 m above mean sea level
Sea temp depth: 1 m below water line
Water depth: 25 m
(24 hours for tsunami stations)
|
Click on the graph icon in the table below to see a time series plot of the last five days of that observation. | |
| NNW ( 330 deg true ) | |
| 3.9 kts | |
| 5.8 kts | |
| 30.03 in | |
| 86.7 °F | |
| 89.4 °F | |
| 86.7 °F | |
| 115.0 °F | |
| 3.9 kts | |
| 3.9 kts | |
| TIME (CDT) |
WDIR |
WSPD kts |
GST kts |
WVHT ft |
DPD sec |
APD sec |
MWD |
PRES in |
PTDY in |
ATMP °F |
WTMP °F |
DEWP °F |
SAL psu |
VIS nmi |
TIDE ft |
|---|---|---|---|---|---|---|---|---|---|---|---|---|---|---|---|
| 2024-07-26 08:05 pm | NNW | 3.9 | 5.8 | - | - | - | - | 30.04 | - | 87.1 | 89.4 | 86.9 | - | - | - |
| 2024-07-26 07:35 pm | NNW | 3.9 | 5.8 | - | - | - | - | 30.03 | - | 86.9 | 89.4 | 86.7 | - | - | - |
| 2024-07-26 07:05 pm | WNW | 3.9 | 5.8 | - | - | - | - | 30.01 | - | 87.1 | 89.6 | 87.1 | - | - | - |
| 2024-07-26 06:35 pm | W | 5.8 | 7.8 | - | - | - | - | 30.00 | - | 87.3 | 89.6 | 87.1 | - | - | - |
| 2024-07-26 06:05 pm | W | 5.8 | 7.8 | - | - | - | - | 30.00 | - | 87.1 | 89.6 | 87.1 | - | - | - |
| 2024-07-26 05:35 pm | W | 7.8 | 9.7 | - | - | - | - | 30.01 | - | 87.3 | 89.6 | 87.3 | - | - | - |
| 2024-07-26 05:05 pm | W | 5.8 | 9.7 | - | - | - | - | 30.02 | - | 87.4 | 89.6 | 87.4 | - | - | - |
| 2024-07-26 04:35 pm | W | 5.8 | 7.8 | - | - | - | - | 30.01 | - | 87.3 | 89.6 | 87.3 | - | - | - |
| 2024-07-26 04:05 pm | SW | 7.8 | 9.7 | - | - | - | - | 30.01 | - | 87.1 | 89.8 | 87.1 | - | - | - |
| 2024-07-26 03:35 pm | SW | 5.8 | 9.7 | - | - | - | - | 30.02 | - | 87.3 | 89.8 | 87.3 | - | - | - |
| 2024-07-26 03:05 pm | SW | 7.8 | 9.7 | - | - | - | - | 30.03 | - | 87.3 | 89.8 | 87.3 | - | - | - |
| 2024-07-26 02:35 pm | SSW | 5.8 | 9.7 | - | - | - | - | 30.03 | - | 86.9 | 89.6 | 86.9 | - | - | - |
| 2024-07-26 02:05 pm | S | 5.8 | 7.8 | - | - | - | - | 30.04 | - | 87.1 | 89.6 | 86.9 | - | - | - |
| 2024-07-26 01:35 pm | S | 5.8 | 9.7 | - | - | - | - | 30.05 | - | 86.7 | 89.6 | 86.5 | - | - | - |
| 2024-07-26 01:05 pm | S | 5.8 | 7.8 | - | - | - | - | 30.06 | - | 86.4 | 89.4 | 86.4 | - | - | - |
| 2024-07-26 12:35 pm | S | 5.8 | 7.8 | - | - | - | - | 30.07 | - | 86.2 | 89.2 | 86.2 | - | - | - |
| 2024-07-26 12:05 pm | S | 5.8 | 7.8 | - | - | - | - | 30.08 | - | 86.0 | 89.2 | 86.0 | - | - | - |
| 2024-07-26 11:35 am | SSE | 5.8 | 7.8 | - | - | - | - | 30.08 | - | 86.0 | 89.1 | 86.0 | - | - | - |
| 2024-07-26 11:05 am | SE | 7.8 | 7.8 | - | - | - | - | 30.08 | - | 85.6 | 89.1 | 85.6 | - | - | - |
| 2024-07-26 10:35 am | SE | 7.8 | 9.7 | - | - | - | - | 30.09 | - | 85.5 | 88.9 | 85.5 | - | - | - |
| 2024-07-26 10:05 am | SE | 7.8 | 11.7 | - | - | - | - | 30.08 | - | 85.3 | 88.9 | 85.3 | - | - | - |
| 2024-07-26 09:35 am | SE | 7.8 | 9.7 | - | - | - | - | 30.08 | - | 85.1 | 88.9 | 85.1 | - | - | - |
| 2024-07-26 09:05 am | SE | 7.8 | 9.7 | - | - | - | - | 30.08 | - | 85.1 | 88.7 | 84.9 | - | - | - |
| 2024-07-26 08:35 am | ESE | 7.8 | 9.7 | - | - | - | - | 30.07 | - | 84.6 | 88.7 | 84.4 | - | - | - |
| 2024-07-26 08:05 am | ESE | 7.8 | 11.7 | - | - | - | - | 30.07 | - | 84.4 | 88.7 | 84.2 | - | - | - |
| 2024-07-26 07:35 am | ESE | 7.8 | 9.7 | - | - | - | - | 30.07 | - | 84.4 | 88.7 | 84.4 | - | - | - |
| 2024-07-26 07:05 am | ESE | 7.8 | 11.7 | - | - | - | - | 30.07 | - | 84.7 | 88.7 | 84.7 | - | - | - |
| 2024-07-26 06:35 am | ESE | 9.7 | 11.7 | - | - | - | - | 30.06 | - | 84.6 | 88.7 | 84.6 | - | - | - |
| 2024-07-26 06:05 am | E | 9.7 | 11.7 | - | - | - | - | 30.06 | - | 84.6 | 88.7 | 84.6 | - | - | - |
| 2024-07-26 05:35 am | E | 9.7 | 11.7 | - | - | - | - | 30.06 | - | 85.1 | 88.7 | 85.1 | - | - | - |
| 2024-07-26 05:05 am | ENE | 7.8 | 11.7 | - | - | - | - | 30.06 | - | 85.1 | 88.7 | 84.9 | - | - | - |
| 2024-07-26 04:35 am | ENE | 9.7 | 11.7 | - | - | - | - | 30.06 | - | 85.3 | 88.7 | 85.3 | - | - | - |
| 2024-07-26 04:05 am | ENE | 9.7 | 11.7 | - | - | - | - | 30.06 | - | 85.3 | 88.7 | 85.3 | - | - | - |
| 2024-07-26 03:35 am | NE | 7.8 | 9.7 | - | - | - | - | 30.07 | - | 85.6 | 88.9 | 85.6 | - | - | - |
| 2024-07-26 03:05 am | NE | 5.8 | 7.8 | - | - | - | - | 30.07 | - | 85.5 | 88.9 | 85.3 | - | - | - |
| 2024-07-26 02:35 am | ENE | 5.8 | 7.8 | - | - | - | - | 30.08 | - | 85.5 | 88.9 | 85.3 | - | - | - |
| 2024-07-26 02:05 am | ENE | 3.9 | 5.8 | - | - | - | - | 30.09 | - | 85.3 | 88.9 | 85.1 | - | - | - |
| 2024-07-26 01:35 am | ENE | 5.8 | 7.8 | - | - | - | - | 30.10 | - | 85.1 | 88.9 | 85.1 | - | - | - |
| 2024-07-26 01:05 am | E | 5.8 | 5.8 | - | - | - | - | 30.11 | - | 85.5 | 88.9 | 85.5 | - | - | - |
| 2024-07-26 12:35 am | E | 3.9 | 5.8 | - | - | - | - | 30.12 | - | 85.1 | 88.9 | 85.1 | - | - | - |
| 2024-07-26 12:05 am | NE | 1.9 | 3.9 | - | - | - | - | 30.12 | - | 84.4 | 89.1 | 84.4 | - | - | - |
| 2024-07-25 11:35 pm | NE | 1.9 | 5.8 | - | - | - | - | 30.13 | - | 83.5 | 89.1 | 83.5 | - | - | - |
| 2024-07-25 11:05 pm | N | 5.8 | 9.7 | - | - | - | - | 30.14 | - | 83.7 | 89.1 | 83.7 | - | - | - |
| 2024-07-25 10:35 pm | N | 11.7 | 13.6 | - | - | - | - | 30.14 | - | 82.8 | 89.1 | 82.8 | - | - | - |
| 2024-07-25 10:05 pm | NNE | 15.5 | 19.4 | - | - | - | - | 30.14 | - | 81.7 | 89.1 | 81.7 | - | - | - |
| 2024-07-25 09:35 pm | ENE | 7.8 | 17.5 | - | - | - | - | 30.14 | - | 84.4 | 89.2 | 84.4 | - | - | - |
| 2024-07-25 09:05 pm | SSE | 11.7 | 13.6 | - | - | - | - | 30.13 | - | 84.2 | 89.2 | 84.2 | - | - | - |
Disclaimer: Ocean current directions are reported to the nearest 10 degrees and speeds are measured to the nearest whole centimeter per second.
Ocean Current Data for 42013
| 7:57 pm CDT | 6:57 pm CDT | 5:57 pm CDT | ||||
|---|---|---|---|---|---|---|
| Depth ft | Dir ° | Speed kts |
Dir ° | Speed kts |
Dir ° | Speed kts |
| 10 | 170 | 0.10 | 210 | 0.08 | 190 | 0.10 |
Previous (up to 48) reports of ocean current data for 42013
Ocean Current Stick Plots are available in metric units only:
All Instruments -  1-day plot 3-day plot 5-day plot
|
Click on the graph icon in the table below to see a time series plot of the last five days of that observation. | ||
| 441.4 | watts/meter2 | |
| TIME (CDT) |
SRAD1 w/m2 |
SRAD2 w/m2 |
LRAD w/m2 |
|---|---|---|---|
| 2024-07-26 08:05 pm | - | - | 441.5 |
| 2024-07-26 07:35 pm | - | - | 437.9 |
| 2024-07-26 07:05 pm | 47.0 | - | 437.3 |
| 2024-07-26 06:35 pm | 163.0 | - | 441.2 |
| 2024-07-26 06:05 pm | 278.6 | - | 441.7 |
| 2024-07-26 05:35 pm | 395.3 | - | 443.6 |
| 2024-07-26 05:05 pm | 519.3 | - | 447.0 |
| 2024-07-26 04:35 pm | 632.6 | - | 449.8 |
| 2024-07-26 04:05 pm | 649.6 | - | 446.6 |
| 2024-07-26 03:35 pm | 656.2 | - | 442.8 |
| 2024-07-26 03:05 pm | 825.0 | - | 443.9 |
| 2024-07-26 02:35 pm | 884.1 | - | 445.9 |
| 2024-07-26 02:05 pm | 940.3 | - | 448.3 |
| 2024-07-26 01:35 pm | 965.1 | - | 449.4 |
| 2024-07-26 01:05 pm | 932.2 | - | 453.1 |
| 2024-07-26 12:35 pm | 983.9 | - | 448.4 |
| 2024-07-26 12:05 pm | 933.4 | - | 445.9 |
| 2024-07-26 11:35 am | 969.7 | - | 450.4 |
| 2024-07-26 11:05 am | 881.8 | - | 442.5 |
| 2024-07-26 10:35 am | 829.3 | - | 440.4 |
| 2024-07-26 10:05 am | 634.0 | - | 440.8 |
| 2024-07-26 09:35 am | 682.8 | - | 435.7 |
| 2024-07-26 09:05 am | 590.1 | - | 433.1 |
| 2024-07-26 08:35 am | 513.9 | - | 432.4 |
| 2024-07-26 08:05 am | 244.1 | - | 431.6 |
| 2024-07-26 07:35 am | 120.7 | - | 425.9 |
| 2024-07-26 07:05 am | 141.8 | - | 429.9 |
| 2024-07-26 06:35 am | 57.7 | - | 427.5 |
| 2024-07-26 06:05 am | 8.4 | - | 426.2 |
| 2024-07-26 05:35 am | - | - | 427.7 |
| 2024-07-26 05:05 am | - | - | 429.1 |
| 2024-07-26 04:35 am | - | - | 429.6 |
| 2024-07-26 04:05 am | - | - | 429.0 |
| 2024-07-26 03:35 am | - | - | 431.1 |
| 2024-07-26 03:05 am | - | - | 432.0 |
| 2024-07-26 02:35 am | - | - | 441.9 |
| 2024-07-26 02:05 am | - | - | 447.8 |
| 2024-07-26 01:35 am | - | - | 444.8 |
| 2024-07-26 01:05 am | 0.1 | - | 452.7 |
| 2024-07-26 12:35 am | 0.8 | - | 445.4 |
| 2024-07-26 12:05 am | 1.3 | - | 451.2 |
| 2024-07-25 11:35 pm | - | - | 448.4 |
| 2024-07-25 11:05 pm | - | - | 450.0 |
| 2024-07-25 10:35 pm | 0.8 | - | 449.0 |
| 2024-07-25 10:05 pm | - | - | 447.2 |
| 2024-07-25 09:35 pm | - | - | 446.1 |
| 2024-07-25 09:05 pm | - | - | 446.4 |
Links which are specific to this station are listed below:
Real Time Data in tabular form for the last forty-five days.
Historical Data & Climatic Summaries for quality controlled data for prior months and years.