


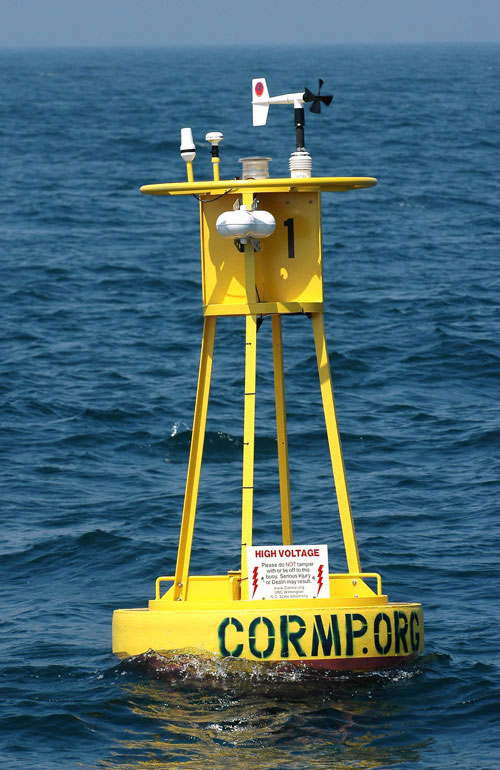
Station 41037 - Wrightsville Beach Offshore, NC (ILM3) 
Owned and maintained by Coastal Ocean Research and Monitoring Program (CORMP)
Moored Buoy
33.988 N 77.362 W (33°59'16" N 77°21'42" W)
Site elevation: sea level
Air temp height: 2.79 m above site elevation
Anemometer height: 2.95 m above site elevation
Barometer elevation: 2.79 m above mean sea level
Sea temp depth: 1 m below water line
Water depth: 30 m
Latest NWS Marine Forecast 1 and Latest NWS Marine Forecast 2
(24 hours for tsunami stations)
|
Click on the graph icon in the table below to see a time series plot of the last five days of that observation. | |
| SW ( 220 deg true ) | |
| 11.7 kts | |
| 17.5 kts | |
| 30.02 in | |
| 80.2 °F | |
| 82.2 °F | |
| 74.7 °F | |
| 85.3 °F | |
| 15.5 kts | |
| 15.5 kts | |
| TIME (EDT) |
WDIR |
WSPD kts |
GST kts |
WVHT ft |
DPD sec |
APD sec |
MWD |
PRES in |
PTDY in |
ATMP °F |
WTMP °F |
DEWP °F |
SAL psu |
VIS nmi |
TIDE ft |
|---|---|---|---|---|---|---|---|---|---|---|---|---|---|---|---|
| 2024-07-26 07:08 pm | SW | 13.6 | 17.5 | - | - | - | - | 29.99 | - | 80.2 | 82.2 | 74.1 | - | - | - |
| 2024-07-26 06:08 pm | SSW | 11.7 | 15.5 | - | - | - | - | 30.02 | - | 80.8 | 82.2 | 75.2 | - | - | - |
| 2024-07-26 05:08 pm | S | 13.6 | 21.4 | - | - | - | - | 30.01 | - | 81.0 | 82.2 | 74.7 | - | - | - |
| 2024-07-26 04:08 pm | SSW | 13.6 | 19.4 | - | - | - | - | 30.03 | - | 81.1 | 82.2 | 74.1 | - | - | - |
| 2024-07-26 03:08 pm | S | 13.6 | 17.5 | - | - | - | - | 30.03 | - | 81.0 | 82.2 | 73.9 | - | - | - |
| 2024-07-26 02:08 pm | SSW | 11.7 | 17.5 | - | - | - | - | 30.06 | - | 79.9 | 82.2 | 73.8 | - | - | - |
| 2024-07-26 01:08 pm | SSW | 9.7 | 13.6 | - | - | - | - | 30.07 | - | 79.0 | 82.2 | 73.0 | - | - | - |
| 2024-07-26 12:08 pm | SSW | 5.8 | 11.7 | - | - | - | - | 30.07 | - | 79.3 | 82.0 | 73.2 | - | - | - |
| 2024-07-26 11:08 am | SW | 7.8 | 11.7 | - | - | - | - | 30.09 | - | 78.8 | 82.0 | 72.9 | - | - | - |
| 2024-07-26 10:08 am | W | 7.8 | 11.7 | - | - | - | - | 30.09 | - | 78.3 | 82.0 | 73.4 | - | - | - |
| 2024-07-26 09:08 am | WNW | 15.5 | 19.4 | - | - | - | - | 30.09 | - | 78.8 | 82.0 | 73.2 | - | - | - |
| 2024-07-26 07:08 am | SW | 9.7 | 15.5 | - | - | - | - | 30.08 | - | 80.8 | 82.0 | 73.9 | - | - | - |
| 2024-07-26 06:08 am | SSW | 11.7 | 17.5 | - | - | - | - | 30.08 | - | 80.6 | 82.0 | 73.9 | - | - | - |
| 2024-07-26 05:08 am | WSW | 11.7 | 19.4 | - | - | - | - | 30.07 | - | 80.6 | 82.0 | 73.6 | - | - | - |
| 2024-07-26 04:08 am | SW | 15.5 | 19.4 | - | - | - | - | 30.08 | - | 79.9 | 82.2 | 73.9 | - | - | - |
| 2024-07-26 03:08 am | WSW | 13.6 | 17.5 | - | - | - | - | 30.09 | - | 78.3 | 82.2 | 72.9 | - | - | - |
| 2024-07-26 02:08 am | WSW | 21.4 | 27.2 | - | - | - | - | 30.12 | - | 77.0 | 82.4 | 72.5 | - | - | - |
| 2024-07-26 01:08 am | WSW | 17.5 | 23.3 | - | - | - | - | 30.09 | - | 79.9 | 82.2 | 74.3 | - | - | - |
| 2024-07-26 12:08 am | SSW | 7.8 | 11.7 | - | - | - | - | 30.14 | - | 81.9 | 82.2 | 76.5 | - | - | - |
| 2024-07-25 11:08 pm | SSW | 11.7 | 21.4 | - | - | - | - | 30.12 | - | 82.0 | 82.4 | 76.3 | - | - | - |
| 2024-07-25 10:08 pm | SSW | 9.7 | 13.6 | - | - | - | - | 30.13 | - | 82.9 | 82.4 | 76.5 | - | - | - |
| 2024-07-25 09:08 pm | SSW | 11.7 | 15.5 | - | - | - | - | 30.12 | - | 82.8 | 82.4 | 76.8 | - | - | - |
Links which are specific to this station are listed below:
Real Time Data in tabular form for the last forty-five days.
Historical Data & Climatic Summaries for quality controlled data for prior months and years.