NDBC has recently revised the NDBC Handbook of Automated Data Quality Control Checks and Procedures. The new document can be found on our Publications page.

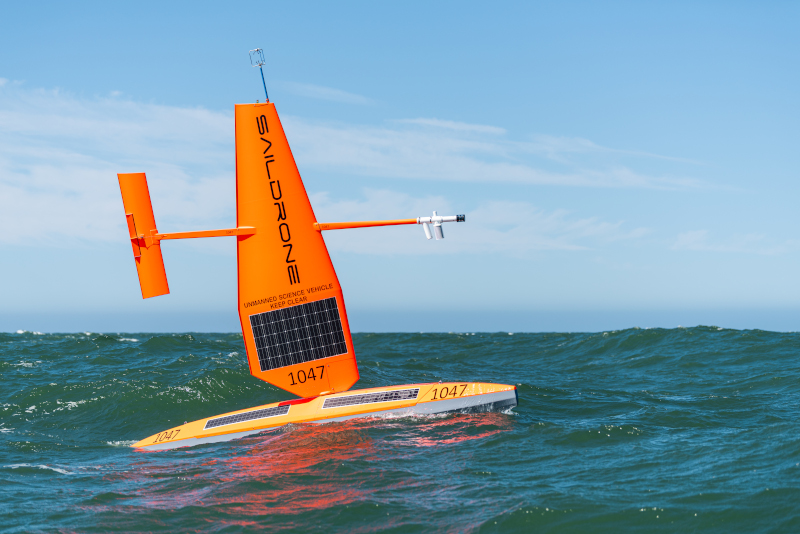
Station 1801593 - SD 1077 - 24 NM SSW of San Francisco, CA (Site of 46012)


Conditions at 1801593 as of
(10:30 am PDT)
1730 GMT on 04/19/2025:
     

Click on the graph icon in the table below to see a time series plot of the last five days of that observation.

5-day plot - Wind Direction Wind Direction (WDIR):SSE (151 deg)
5-day plot - Wind Speed Wind Speed (WSPD): 5.6 kts
5-day plot - Wind Gust Wind Gust (GST): 7.6 kts
5-day plot - Wave Height Wave Height (WVHT): 4.9 ft
5-day plot - Dominant Wave Period Dominant Wave Period (DPD): 8 sec
5-day plot - Atmospheric Pressure Atmospheric Pressure (PRES):30.18 in
5-day plot - Air Temperature Air Temperature (ATMP): 52.5 °F
5-day plot - Water Temperature Water Temperature (WTMP): 55.4 °F
5-day plot - Dew Point Dew Point (DEWP): 50.5 °F
5-day plot -  Wind Speed, Wind Gust and Atmospheric Pressure Combined plot of Wind Speed, Gust, and Air Pressure
Previous 25 observations
TIME
(PDT)
LAT
deg
LON
deg
5-day plot - Wind Direction
WDIR
 
5-day plot - Wind Speed
WSPD
kts
5-day plot - Wind Gust
WGST
kts
5-day plot - Wave Height
WVHT
ft
5-day plot - Dominant Wave Period
DPD
sec
5-day plot - Atmospheric Pressure
PRES
in
5-day plot - Pressure Tendency
PTDY
in
5-day plot - Air Temperature
ATMP
°F
5-day plot - Water Temperature
WTMP
°F
5-day plot - Dew Point
DEWP
°F
2025-04-19 09:30 am  37.25-122.79 SE 2 3 5.9 830.17- 52.2 54.0 50.4
2025-04-19 08:30 am  37.26-122.78 N 1 2 5.6 830.15- 51.6 53.8 50.2
2025-04-19 07:30 am  37.26-122.78 N 1 3 5.2 830.14- 51.1 54.0 50.0
2025-04-19 06:30 am  37.27-122.77SSW 4 5 5.2 830.11- 51.3 54.0 50.2
2025-04-19 05:30 am  37.28-122.77WSW 3 5 4.6 930.09- 51.4 54.0 50.4
2025-04-19 04:30 am  37.29-122.77WSW 3 4 4.9 930.08- 51.1 54.0 50.0
2025-04-19 03:30 am  37.30-122.78NNW 2 3 4.9 830.07- 50.9 54.0 50.0
2025-04-19 02:30 am  37.31-122.79NNW 3 3 4.6 930.06- 50.5 54.0 49.8
2025-04-19 01:30 am  37.32-122.80 NW 3 4 4.6 930.07- 50.9 54.0 50.2
2025-04-19 12:30 am  37.32-122.81WNW 6 8 4.3 930.07- 51.3 54.0 50.5
2025-04-18 11:30 pm  37.33-122.81 NW 8 9 4.9 1030.06- 51.3 54.0 50.4
2025-04-18 10:30 pm  37.34-122.80NNW 6 8 5.2 830.06- 51.4 54.0 50.5
2025-04-18 09:30 pm  37.34-122.79NNW 4 5 5.2 930.06- 51.4 54.0 50.2
2025-04-18 08:30 pm  37.35-122.80NNW 10 12 4.9 1030.04- 52.2 54.0 50.7
2025-04-18 07:30 pm  37.35-122.81 NW 10 12 4.9 1030.02- 53.2 54.3 51.3
2025-04-18 06:30 pm  37.35-122.82NNW 10 12 5.6 1030.03- 53.6 54.9 51.3
2025-04-18 05:30 pm  37.35-122.83NNW 9 10 5.6 1030.03- 53.4 55.0 50.7
2025-04-18 04:30 pm  37.34-122.84 NW 10 11 5.9 1130.03- 53.8 55.0 50.5
2025-04-18 03:30 pm  37.33-122.84 NW 8 9 5.6 1030.04- 53.4 54.9 50.2
2025-04-18 02:30 pm  37.32-122.84WNW 7 8 5.2 930.05- 52.9 55.0 49.8
2025-04-18 01:30 pm  37.32-122.84 NW 4 5 5.2 1130.06- 52.9 54.5 50.2
2025-04-18 12:30 pm  37.33-122.84WNW 3 4 4.9 1030.07- 52.9 54.7 50.4
2025-04-18 11:30 am  37.33-122.84 N 1 1 4.6 1030.06- 53.2 54.1 50.9
2025-04-18 10:30 am  37.33-122.85NNW 3 4 5.2 1030.06- 51.6 54.0 50.4