


![]() View the latest observations near Atlantic Remnants Of Bertha and East Pacific Hurricane Fausto.
View the latest observations near Atlantic Remnants Of Bertha and East Pacific Hurricane Fausto.
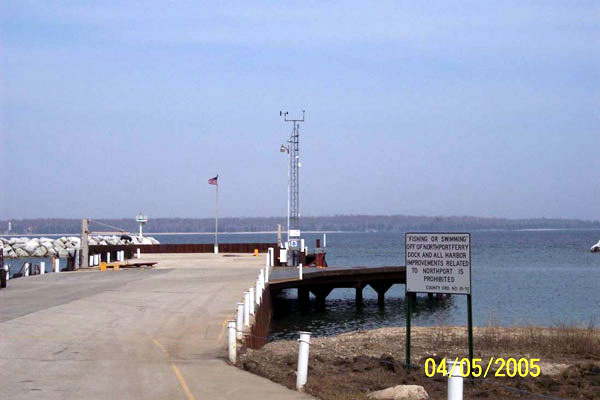
Station NPDW3 - Northport Pier at Death's Door, WI 
Owned and maintained by NWS WFO Green Bay, WI (GRB)
Weather Station
45.291 N 86.977 W (45°17'27" N 86°58'36" W)
Site elevation: 178 m above mean sea level
Air temp height: 10 m above site elevation
Anemometer height: 10 m above site elevation
Large icon indicates selected station.
 Stations with recent data
 Stations with no data in last 8 hours
(24 hours for tsunami stations)
(24 hours for tsunami stations)
|
Click on the graph icon in the table below to see a time series plot of the last five days of that observation. | |
| SSE ( 150 deg true ) | |
| 2.9 kts | |
| 8.0 kts | |
| 30.13 in | |
| +0.02 in ( Rising ) | |
| 3.9 kts | |
| 3.9 kts | |
| TIME (CDT) |
WDIR |
WSPD kts |
GST kts |
WVHT ft |
DPD sec |
APD sec |
MWD |
PRES in |
PTDY in |
ATMP °F |
WTMP °F |
DEWP °F |
SAL psu |
VIS nmi |
TIDE ft |
|---|---|---|---|---|---|---|---|---|---|---|---|---|---|---|---|
| 2026-07-23 08:50 pm | SSE | 4.1 | 7.0 | - | - | - | - | 30.12 | - | - | - | - | - | - | - |
| 2026-07-23 08:00 pm | SSE | 4.1 | 8.9 | - | - | - | - | 30.12 | +0.00 | - | - | - | - | - | - |
| 2026-07-23 07:50 pm | SSE | 5.1 | 8.9 | - | - | - | - | 30.11 | - | - | - | - | - | - | - |
| 2026-07-23 07:00 pm | SE | 6.0 | 8.9 | - | - | - | - | 30.12 | -0.01 | - | - | - | - | - | - |
| 2026-07-23 06:50 pm | SE | 5.1 | 13.0 | - | - | - | - | 30.11 | - | - | - | - | - | - | - |
| 2026-07-23 06:00 pm | SSE | 8.0 | 13.0 | - | - | - | - | 30.11 | -0.02 | - | - | - | - | - | - |
| 2026-07-23 05:50 pm | SSE | 7.0 | 13.0 | - | - | - | - | 30.12 | - | - | - | - | - | - | - |
| 2026-07-23 05:00 pm | SE | 7.0 | 12.0 | - | - | - | - | 30.12 | -0.02 | - | - | - | - | - | - |
| 2026-07-23 04:50 pm | SE | 6.0 | 13.0 | - | - | - | - | 30.12 | - | - | - | - | - | - | - |
| 2026-07-23 04:00 pm | SE | 7.0 | 14.0 | - | - | - | - | 30.13 | -0.02 | - | - | - | - | - | - |
| 2026-07-23 03:50 pm | SE | 8.9 | 15.9 | - | - | - | - | 30.13 | - | - | - | - | - | - | - |
| 2026-07-23 03:00 pm | SE | 9.9 | 14.0 | - | - | - | - | 30.13 | -0.03 | - | - | - | - | - | - |
| 2026-07-23 02:50 pm | ESE | 9.9 | 13.0 | - | - | - | - | 30.13 | - | - | - | - | - | - | - |
| 2026-07-23 02:00 pm | SE | 9.9 | 15.0 | - | - | - | - | 30.14 | -0.03 | - | - | - | - | - | - |
| 2026-07-23 01:50 pm | S | 6.0 | 12.0 | - | - | - | - | 30.15 | - | - | - | - | - | - | - |
| 2026-07-23 01:00 pm | SW | 5.1 | 13.0 | - | - | - | - | 30.15 | -0.02 | - | - | - | - | - | - |
| 2026-07-23 12:50 pm | SW | 2.9 | 11.1 | - | - | - | - | 30.16 | - | - | - | - | - | - | - |
| 2026-07-23 12:00 pm | SW | 5.1 | 9.9 | - | - | - | - | 30.16 | -0.01 | - | - | - | - | - | - |
| 2026-07-23 11:50 am | SSW | 6.0 | 17.1 | - | - | - | - | 30.16 | - | - | - | - | - | - | - |
| 2026-07-23 11:00 am | SW | 4.1 | 11.1 | - | - | - | - | 30.17 | -0.01 | - | - | - | - | - | - |
| 2026-07-23 10:50 am | SSW | 5.1 | 9.9 | - | - | - | - | 30.17 | - | - | - | - | - | - | - |
| 2026-07-23 10:00 am | WSW | 1.9 | 11.1 | - | - | - | - | 30.17 | +0.00 | - | - | - | - | - | - |
| 2026-07-23 09:50 am | WSW | 6.0 | - | - | - | - | - | 30.17 | - | - | - | - | - | - | - |
| 2026-07-23 09:00 am | WSW | 2.9 | 9.9 | - | - | - | - | 30.17 | +0.02 | - | - | - | - | - | - |
| 2026-07-23 08:50 am | SW | 2.9 | 8.0 | - | - | - | - | 30.18 | - | - | - | - | - | - | - |
| 2026-07-23 08:00 am | - | - | - | - | - | - | - | 30.18 | +0.04 | - | - | - | - | - | - |
| 2026-07-23 07:50 am | WSW | 4.1 | 7.0 | - | - | - | - | 30.17 | - | - | - | - | - | - | - |
| 2026-07-23 07:00 am | WSW | 2.9 | 5.1 | - | - | - | - | 30.17 | +0.03 | - | - | - | - | - | - |
| 2026-07-23 06:50 am | WSW | 2.9 | 6.0 | - | - | - | - | 30.17 | - | - | - | - | - | - | - |
| 2026-07-23 06:00 am | SW | 1.9 | 4.1 | - | - | - | - | 30.15 | +0.01 | - | - | - | - | - | - |
| 2026-07-23 05:50 am | WSW | 1.9 | 4.1 | - | - | - | - | 30.15 | - | - | - | - | - | - | - |
| 2026-07-23 05:00 am | WSW | 2.9 | 5.1 | - | - | - | - | 30.14 | +0.01 | - | - | - | - | - | - |
| 2026-07-23 04:50 am | SW | 1.9 | 4.1 | - | - | - | - | 30.14 | - | - | - | - | - | - | - |
| 2026-07-23 04:00 am | SW | 1.9 | 5.1 | - | - | - | - | 30.14 | +0.02 | - | - | - | - | - | - |
| 2026-07-23 03:50 am | SW | 2.9 | 4.1 | - | - | - | - | 30.14 | - | - | - | - | - | - | - |
| 2026-07-23 03:00 am | WSW | 2.9 | 5.1 | - | - | - | - | 30.14 | +0.03 | - | - | - | - | - | - |
| 2026-07-23 02:50 am | WSW | 2.9 | 6.0 | - | - | - | - | 30.14 | - | - | - | - | - | - | - |
| 2026-07-23 02:00 am | W | 5.1 | 8.9 | - | - | - | - | 30.13 | +0.02 | - | - | - | - | - | - |
| 2026-07-23 01:50 am | W | 4.1 | 6.0 | - | - | - | - | 30.13 | - | - | - | - | - | - | - |
| 2026-07-23 01:00 am | WSW | 2.9 | 5.1 | - | - | - | - | 30.12 | +0.01 | - | - | - | - | - | - |
| 2026-07-23 12:50 am | WSW | 2.9 | 6.0 | - | - | - | - | 30.12 | - | - | - | - | - | - | - |
| 2026-07-23 12:00 am | WSW | 4.1 | 6.0 | - | - | - | - | 30.11 | +0.02 | - | - | - | - | - | - |
| 2026-07-22 11:50 pm | WSW | 4.1 | 4.1 | - | - | - | - | 30.11 | - | - | - | - | - | - | - |
| 2026-07-22 11:00 pm | WSW | 2.9 | 6.0 | - | - | - | - | 30.11 | +0.03 | - | - | - | - | - | - |
| 2026-07-22 10:50 pm | WSW | 2.9 | 6.0 | - | - | - | - | 30.11 | - | - | - | - | - | - | - |
| 2026-07-22 10:00 pm | W | 4.1 | 7.0 | - | - | - | - | 30.11 | - | - | - | - | - | - | - |
| 2026-07-22 09:50 pm | WSW | 5.1 | 8.0 | - | - | - | - | 30.10 | - | - | - | - | - | - | - |
Links which are specific to this station are listed below:
Real Time Data in tabular form for the last forty-five days.
Historical Data & Climatic Summaries for quality controlled data for prior months and years.