


![]() View the latest observations near Central Pacific Hurricane Fausto and East Pacific Hurricane Genevieve.
View the latest observations near Central Pacific Hurricane Fausto and East Pacific Hurricane Genevieve.
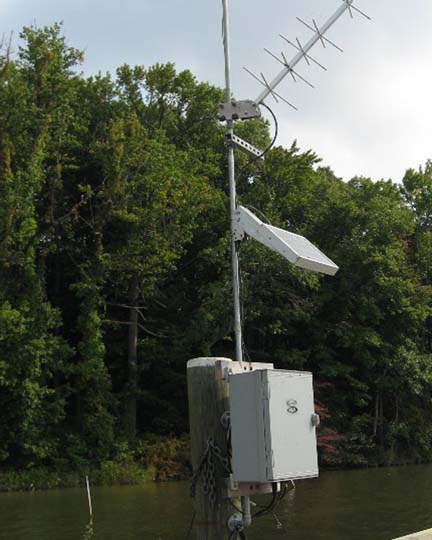
Station LTQM2 - Otter Point Creek, Chesapeake Bay Reserve, MD
Owned and maintained by National Estuarine Research Reserve System
NERRS Water Quality Station
39.451 N 76.275 W (39°27'3" N 76°16'29" W)
Large icon indicates selected station.
 Stations with recent data
 Stations with no data in last 8 hours
(24 hours for tsunami stations)
(24 hours for tsunami stations)
|
These oceanographic data are displayed in rounded times. Click on the graph icon in the table below to see a time series plot of the last five days of that observation. | |
| Depth (DEPTH): | 2.0 ft |
| 78.08 °F | |
| 0.89 mS/cm | |
| 0.40 psu | |
| 12.5% | |
| 1.00 ppm | |
| 0 FTU | |
| 7.30 | |
| TIME (EDT) |
DEPTH ft |
OTMP °F |
COND mS/cm |
SAL psu |
O2% % |
O2PPM ppm |
CLCON ug/l |
TURB FTU |
PH |
EH mV |
|---|---|---|---|---|---|---|---|---|---|---|
| 2026-07-26 07:45 pm | 2.0 | 78.08 | 0.89 | 0.40 | 12.60 | 1.00 | - | 0 | 7.30 | - |
| 2026-07-26 07:30 pm | 2.3 | 78.08 | 0.89 | 0.40 | 12.00 | 1.00 | - | 0 | 7.30 | - |
| 2026-07-26 07:15 pm | 2.0 | 78.08 | 0.89 | 0.40 | 13.70 | 1.10 | - | - | 7.30 | - |
| 2026-07-26 07:00 pm | 2.0 | 78.08 | 0.89 | 0.40 | 14.20 | 1.20 | - | 0 | 7.30 | - |
| 2026-07-26 06:45 pm | 2.0 | 78.08 | 0.89 | 0.40 | 14.70 | 1.20 | - | 0 | 7.30 | - |
| 2026-07-26 06:30 pm | 2.0 | 78.08 | 0.89 | 0.40 | 15.40 | 1.30 | - | - | 7.30 | - |
| 2026-07-26 06:15 pm | 2.0 | 78.08 | 0.89 | 0.40 | 17.60 | 1.40 | - | 0 | 7.30 | - |
| 2026-07-26 06:00 pm | 2.0 | 78.08 | 0.89 | 0.40 | 20.00 | 1.60 | - | 0 | 7.30 | - |
| 2026-07-26 05:45 pm | 2.0 | 78.08 | 0.88 | 0.40 | 23.80 | 1.90 | - | 0 | 7.40 | - |
| 2026-07-26 05:30 pm | 2.0 | 78.08 | 0.88 | 0.40 | 24.90 | 2.00 | - | 0 | 7.40 | - |
| 2026-07-26 05:15 pm | 2.0 | 78.08 | 0.88 | 0.40 | 26.60 | 2.20 | - | 0 | 7.50 | - |
| 2026-07-26 05:00 pm | 2.0 | 78.08 | 0.88 | 0.40 | 27.00 | 2.20 | - | 0 | 7.50 | - |
| 2026-07-26 04:45 pm | 2.0 | 78.08 | 0.88 | 0.40 | 31.10 | 2.50 | - | 1 | 7.50 | - |
| 2026-07-26 04:30 pm | 2.0 | 78.08 | 0.88 | 0.40 | 35.30 | 2.90 | - | - | 7.60 | - |
| 2026-07-26 04:15 pm | 1.6 | 78.08 | 0.88 | 0.40 | 33.40 | 2.70 | - | - | 7.60 | - |
| 2026-07-26 04:00 pm | 1.6 | 78.08 | 0.88 | 0.40 | 32.00 | 2.60 | - | 0 | 7.70 | - |
| 2026-07-26 03:45 pm | 1.6 | 78.08 | 0.88 | 0.40 | 34.20 | 2.80 | - | - | 7.70 | - |
| 2026-07-26 03:30 pm | 1.6 | 78.08 | 0.88 | 0.40 | 36.70 | 3.00 | - | - | 7.80 | - |
| 2026-07-26 03:15 pm | 1.6 | 78.08 | 0.88 | 0.40 | 38.80 | 3.20 | - | - | 7.80 | - |
| 2026-07-26 03:00 pm | 1.6 | 77.90 | 0.87 | 0.40 | 39.90 | 3.30 | - | - | 7.80 | - |
| 2026-07-26 02:45 pm | 1.6 | 77.90 | 0.87 | 0.40 | 37.90 | 3.10 | - | - | 7.70 | - |
| 2026-07-26 02:30 pm | 1.3 | 77.72 | 0.88 | 0.40 | 31.00 | 2.50 | - | - | 7.70 | - |
| 2026-07-26 02:15 pm | 1.3 | 77.72 | 0.88 | 0.40 | 26.00 | 2.10 | - | - | 7.60 | - |
| 2026-07-26 01:00 pm | 1.6 | 77.54 | 0.88 | 0.40 | 22.00 | 1.80 | - | - | 7.60 | - |
| 2026-07-26 12:45 pm | 1.6 | 77.54 | 0.88 | 0.40 | 23.40 | 1.90 | - | - | 7.70 | - |
| 2026-07-26 12:30 pm | 1.6 | 77.54 | 0.89 | 0.40 | 25.70 | 2.10 | - | - | 7.70 | - |
| 2026-07-26 12:15 pm | 1.6 | 77.72 | 0.87 | 0.40 | 37.90 | 3.10 | - | - | 8.10 | - |
| 2026-07-26 12:00 pm | 2.0 | 77.54 | 0.89 | 0.40 | 27.90 | 2.30 | - | - | 7.80 | - |
| 2026-07-26 11:45 am | 2.0 | 77.54 | 0.88 | 0.40 | 36.50 | 3.00 | - | - | 8.00 | - |
| 2026-07-26 11:30 am | 2.0 | 77.72 | 0.87 | 0.40 | 39.00 | 3.20 | - | - | 8.10 | - |
| 2026-07-26 11:15 am | 2.0 | 77.36 | 0.88 | 0.40 | 35.90 | 3.00 | - | - | 8.10 | - |
| 2026-07-26 11:00 am | 2.3 | 77.36 | 0.88 | 0.40 | 35.10 | 2.90 | - | - | 8.10 | - |
| 2026-07-26 10:45 am | 2.3 | 77.36 | 0.88 | 0.40 | 36.50 | 3.00 | - | - | 8.10 | - |
| 2026-07-26 10:30 am | 2.3 | 77.36 | 0.88 | 0.40 | 37.40 | 3.10 | - | - | 8.10 | - |
| 2026-07-26 10:15 am | 2.3 | 77.36 | 0.88 | 0.40 | 37.40 | 3.10 | - | - | 8.20 | - |
| 2026-07-26 10:00 am | 2.6 | 77.36 | 0.88 | 0.40 | 38.60 | 3.20 | - | - | 8.20 | - |
| 2026-07-26 09:45 am | 2.6 | 77.36 | 0.89 | 0.40 | 40.70 | 3.30 | - | - | 8.40 | - |
| 2026-07-26 09:30 am | 2.6 | 77.36 | 0.89 | 0.40 | 42.00 | 3.50 | - | - | 8.40 | - |
| 2026-07-26 09:15 am | 2.6 | 77.54 | 0.90 | 0.40 | 44.20 | 3.60 | - | - | 8.50 | - |
| 2026-07-26 09:00 am | 2.6 | 77.72 | 0.93 | 0.50 | 49.60 | 4.10 | - | - | 8.60 | - |
| 2026-07-26 08:45 am | 2.6 | 77.90 | 0.97 | 0.50 | 60.40 | 4.90 | - | 0 | 8.80 | - |
| 2026-07-26 08:30 am | 2.6 | 77.90 | 0.98 | 0.50 | 64.20 | 5.20 | - | - | 8.80 | - |
| 2026-07-26 08:15 am | 3.0 | 77.90 | 0.99 | 0.50 | 65.30 | 5.30 | - | 0 | 8.80 | - |
| 2026-07-26 08:00 am | 3.0 | 77.90 | 0.99 | 0.50 | 64.80 | 5.30 | - | - | 8.80 | - |
| 2026-07-26 07:45 am | 3.0 | 77.90 | 1.00 | 0.50 | 65.10 | 5.30 | - | - | 8.80 | - |
| 2026-07-26 07:30 am | 3.0 | 77.90 | 0.97 | 0.50 | 60.00 | 4.90 | - | - | 8.80 | - |
| 2026-07-26 07:15 am | 3.0 | 77.90 | 0.97 | 0.50 | 61.80 | 5.00 | - | - | 8.80 | - |
| 2026-07-26 07:00 am | 3.0 | 77.90 | 0.96 | 0.50 | 61.60 | 5.00 | - | - | 8.90 | - |
| 2026-07-26 06:45 am | 3.0 | 78.08 | 1.01 | 0.50 | 67.20 | 5.50 | - | - | 8.80 | - |
| 2026-07-26 06:30 am | 3.0 | 78.08 | 0.97 | 0.50 | 63.70 | 5.20 | - | - | 8.90 | - |
| 2026-07-26 06:15 am | 3.0 | 78.08 | 0.98 | 0.50 | 65.30 | 5.30 | - | - | 8.90 | - |
| 2026-07-26 06:00 am | 3.0 | 78.08 | 0.94 | 0.50 | 63.30 | 5.20 | - | - | 8.90 | - |
| 2026-07-26 05:45 am | 2.6 | 78.08 | 0.94 | 0.50 | 63.30 | 5.20 | - | - | 8.90 | - |
| 2026-07-26 05:30 am | 2.6 | 78.26 | 0.93 | 0.50 | 64.30 | 5.20 | - | - | 9.00 | - |
| 2026-07-26 05:15 am | 2.6 | 78.44 | 0.92 | 0.50 | 66.90 | 5.40 | - | - | 9.00 | - |
| 2026-07-26 05:00 am | 2.6 | 78.44 | 0.93 | 0.50 | 68.60 | 5.60 | - | - | 9.00 | - |
| 2026-07-26 04:45 am | 2.6 | 78.44 | 0.92 | 0.50 | 71.30 | 5.80 | - | - | 9.10 | - |
| 2026-07-26 04:30 am | 2.6 | 78.62 | 0.92 | 0.50 | 74.00 | 6.00 | - | - | 9.10 | - |
| 2026-07-26 04:15 am | 2.3 | 78.62 | 0.90 | 0.40 | 69.30 | 5.60 | - | - | 9.00 | - |
| 2026-07-26 04:00 am | 2.3 | 78.62 | 0.90 | 0.40 | 61.30 | 5.00 | - | - | 8.70 | - |
| 2026-07-26 03:45 am | 2.3 | 78.44 | 0.86 | 0.40 | 26.60 | 2.20 | - | 0 | 7.50 | - |
| 2026-07-26 03:30 am | 2.3 | 78.26 | 0.86 | 0.40 | 16.60 | 1.40 | - | 1 | 7.20 | - |
| 2026-07-26 03:15 am | 2.0 | 78.26 | 0.86 | 0.40 | 12.70 | 1.00 | - | 2 | 7.20 | - |
| 2026-07-26 03:00 am | 2.0 | 78.26 | 0.85 | 0.40 | 7.30 | 0.60 | - | 2 | 7.20 | - |
| 2026-07-26 02:45 am | 2.0 | 78.26 | 0.85 | 0.40 | 11.70 | 1.00 | - | 1 | 7.20 | - |
| 2026-07-26 02:30 am | 2.0 | 78.44 | 0.85 | 0.40 | 15.40 | 1.30 | - | 1 | 7.20 | - |
| 2026-07-26 02:15 am | 1.6 | 78.44 | 0.85 | 0.40 | 15.10 | 1.20 | - | 2 | 7.20 | - |
| 2026-07-26 02:00 am | 1.6 | 78.62 | 0.85 | 0.40 | 23.00 | 1.90 | - | 0 | 7.30 | - |
| 2026-07-26 01:45 am | 1.6 | 78.44 | 0.85 | 0.40 | 19.40 | 1.60 | - | 3 | 7.20 | - |
| 2026-07-26 01:30 am | 1.3 | 78.26 | 0.85 | 0.40 | 20.60 | 1.70 | - | 2 | 7.30 | - |
| 2026-07-26 01:15 am | 1.3 | 78.44 | 0.85 | 0.40 | 24.10 | 2.00 | - | 5 | 7.30 | - |
| 2026-07-26 01:00 am | 1.3 | 78.26 | 0.85 | 0.40 | 22.60 | 1.80 | - | 4 | 7.30 | - |
| 2026-07-26 12:45 am | 1.3 | 78.26 | 0.85 | 0.40 | 22.70 | 1.90 | - | 3 | 7.30 | - |
| 2026-07-26 12:30 am | 1.3 | 78.08 | 0.85 | 0.40 | 20.60 | 1.70 | - | 2 | 7.30 | - |
| 2026-07-26 12:15 am | 1.3 | 78.08 | 0.85 | 0.40 | 19.30 | 1.60 | - | 1 | 7.30 | - |
| 2026-07-26 12:00 am | 1.3 | 77.90 | 0.85 | 0.40 | 19.60 | 1.60 | - | 1 | 7.30 | - |
| 2026-07-25 11:45 pm | 1.3 | 77.90 | 0.85 | 0.40 | 19.40 | 1.60 | - | 1 | 7.30 | - |
| 2026-07-25 11:30 pm | 1.3 | 77.90 | 0.85 | 0.40 | 19.40 | 1.60 | - | 2 | 7.30 | - |
| 2026-07-25 11:15 pm | 1.6 | 77.90 | 0.85 | 0.40 | 19.80 | 1.60 | - | 1 | 7.30 | - |
| 2026-07-25 11:00 pm | 1.6 | 77.90 | 0.85 | 0.40 | 18.10 | 1.50 | - | 1 | 7.30 | - |
| 2026-07-25 10:45 pm | 1.6 | 77.90 | 0.85 | 0.40 | 18.60 | 1.50 | - | 1 | 7.30 | - |
| 2026-07-25 10:30 pm | 1.6 | 77.72 | 0.85 | 0.40 | 18.10 | 1.50 | - | 1 | 7.30 | - |
| 2026-07-25 10:15 pm | 1.6 | 77.72 | 0.85 | 0.40 | 19.30 | 1.60 | - | 2 | 7.30 | - |
| 2026-07-25 10:00 pm | 1.6 | 77.72 | 0.85 | 0.40 | 19.30 | 1.60 | - | 1 | 7.40 | - |
| 2026-07-25 09:45 pm | 1.6 | 77.72 | 0.85 | 0.40 | 20.50 | 1.70 | - | 1 | 7.40 | - |
| 2026-07-25 09:30 pm | 1.6 | 77.54 | 0.85 | 0.40 | 20.00 | 1.60 | - | 0 | 7.40 | - |
| 2026-07-25 09:15 pm | 1.6 | 77.54 | 0.85 | 0.40 | 21.00 | 1.70 | - | - | 7.40 | - |
| 2026-07-25 09:00 pm | 1.6 | 77.54 | 0.85 | 0.40 | 19.80 | 1.60 | - | - | 7.40 | - |
Historical data for station LTQM2 are available at the NERRS website.