Hurricane Symbol View the latest observations near Atlantic Tropical Storm Philippe and Atlantic Tropical Storm Rina.

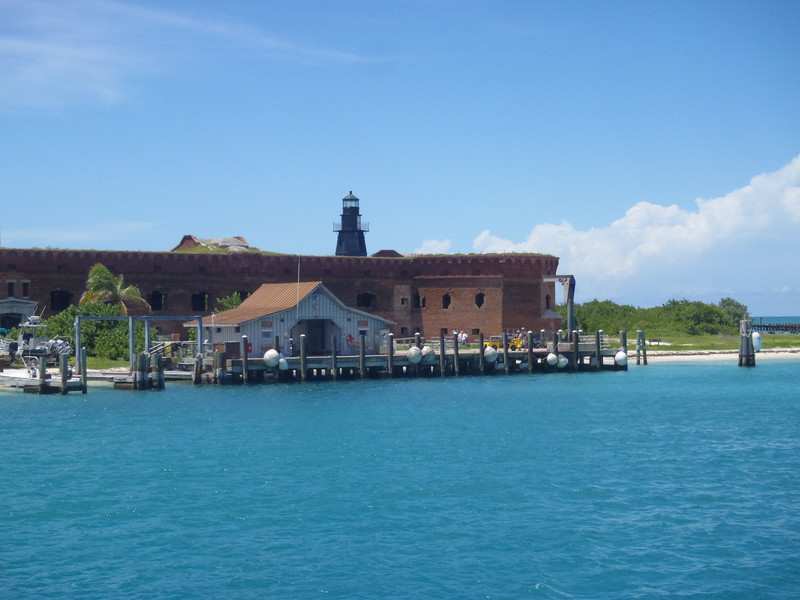
Station GKYF1 - Garden Key, FL Image indicating link to RSS feed of recent meteorological observations for station GKYF1


Conditions at GKYF1 as of
(1:00 pm EDT)
1700 GMT on 10/01/2023:
     

Click on the graph icon in the table below to see a time series plot of the last five days of that observation.

5-day plot - Air Temperature Air Temperature (ATMP): 81.7 °F
5-day plot - Tide (above MLLW) Tide (above MLLW) (TIDE): 0.44 ft
Previous observations
TIME
(EDT)
5-day plot - Wind Direction
WDIR
 
5-day plot - Wind Speed
WSPD
kts
5-day plot - Wind Gust
GST
kts
5-day plot - Wave Height
WVHT
ft
5-day plot - Dominant Wave Period
DPD
sec
5-day plot - Average Wave Period
APD
sec
5-day plot - Mean Wave Direction
MWD
 
5-day plot - Atmospheric Pressure
PRES
in
5-day plot - Pressure Tendency
PTDY
in
5-day plot - Air Temperature
ATMP
°F
5-day plot - Water Temperature
WTMP
°F
5-day plot - Dew Point
DEWP
°F
5-day plot - Salinity
SAL
psu
5-day plot - Visibility
VIS
nmi
5-day plot - Tide (above MLLW)
TIDE
ft
2023-10-01 12:00 pm--------- 80.6---- 0.39
2023-10-01 11:00 am--------- 81.0---- 0.12
2023-10-01 10:00 am--------- 84.7-----0.22
2023-10-01 09:00 am--------- 84.0-----0.52
2023-10-01 08:00 am--------- 83.3-----0.80
2023-10-01 07:00 am--------- 83.5-----1.04
2023-10-01 06:00 am--------- 83.5-----1.11
2023-10-01 05:00 am--------- 83.5-----0.92
2023-10-01 04:00 am--------- 83.5-----0.60
2023-10-01 03:00 am--------- 83.3-----0.21
2023-10-01 02:00 am--------- 82.9---- 0.27
2023-10-01 01:00 am--------- 82.9---- 0.57
2023-10-01 12:00 am--------- 83.1---- 0.78
2023-09-30 11:00 pm--------- 83.3---- 0.94
2023-09-30 10:00 pm--------- 83.3---- 0.61
2023-09-30 09:00 pm--------- 83.3---- 0.36
2023-09-30 08:00 pm--------- 83.7---- 0.13
2023-09-30 06:00 pm--------- 86.5-----0.44
2023-09-30 05:00 pm--------- 90.1-----0.48
2023-09-30 04:00 pm--------- 88.7-----0.25
2023-09-30 03:00 pm--------- 86.0-----0.01
2023-09-30 02:00 pm--------- 84.2---- 0.28

Ocean Conditions at GKYF1 as of
(1:00 pm EDT)
1700 GMT on 10/01/2023:

These oceanographic data are displayed in rounded times.


Click on the graph icon in the table below to see a time series plot of the last five days of that observation.

Depth (DEPTH): 4.9 ft
5-day plot - Ocean Temperature Ocean Temperature (OTMP):85.51 °F
Previous observations
TIME
(EDT)
DEPTH
ft
5-day plot - Ocean Temperature
OTMP
°F
5-day plot - Conductivity
COND
mS/cm
5-day plot - Salinity
SAL
psu
5-day plot - Oxygen Concentration
O2%
%
5-day plot - Oxygen Concentration
O2PPM
ppm
5-day plot - Chlorophyll
CLCON
ug/l
5-day plot - Turbidity
TURB
FTU
5-day plot - pH
PH
 
5-day plot - Eh
EH
mv
2023-10-01 12:00 pm 4.985.44--------
2023-10-01 11:00 am 4.985.44--------
2023-10-01 10:00 am 4.985.37--------
2023-10-01 09:00 am 4.985.44--------
2023-10-01 08:00 am 4.984.79--------
2023-10-01 07:00 am 4.984.79--------
2023-10-01 06:00 am 4.984.94--------
2023-10-01 05:00 am 4.985.12--------
2023-10-01 04:00 am 4.985.17--------
2023-10-01 03:00 am 4.985.28--------
2023-10-01 02:00 am 4.984.92--------
2023-10-01 01:00 am 4.985.35--------
2023-10-01 12:00 am 4.985.55--------
2023-09-30 11:00 pm 4.985.69--------
2023-09-30 10:00 pm 4.985.84--------
2023-09-30 09:00 pm 4.986.22--------
2023-09-30 08:00 pm 4.986.43--------
2023-09-30 06:00 pm 4.986.00--------
2023-09-30 05:00 pm 4.986.11--------
2023-09-30 04:00 pm 4.986.09--------
2023-09-30 03:00 pm 4.986.20--------
2023-09-30 02:00 pm 4.986.05--------