


![]() View the latest observations near Atlantic Tropical Storm Bertha and East Pacific Hurricane Fausto.
View the latest observations near Atlantic Tropical Storm Bertha and East Pacific Hurricane Fausto.
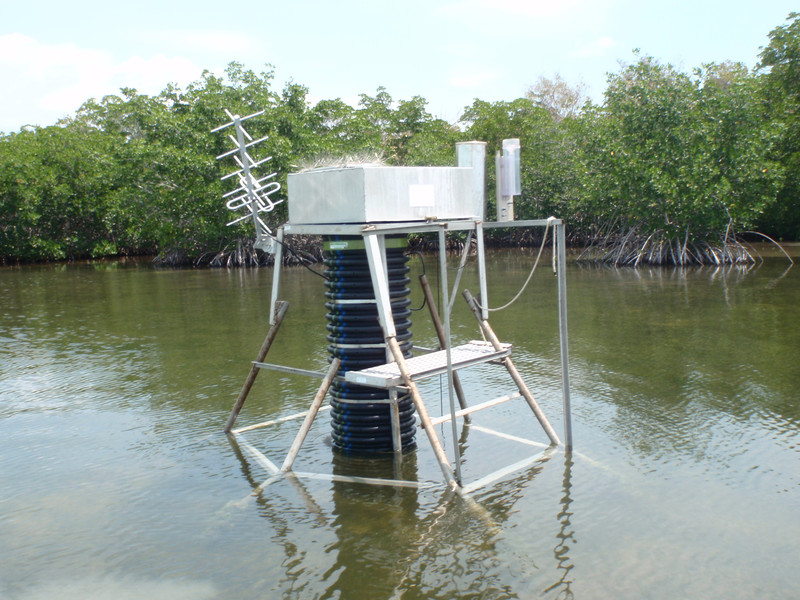
Station BWSF1 - Blackwater Sound, FL 
Owned and maintained by Everglades National Park
Water Quality Station
25.178 N 80.438 W (25°10'42" N 80°26'18" W)
Site elevation: sea level
Sea temp depth: 1.5 m below MLLW
(24 hours for tsunami stations)
|
Click on the graph icon in the table below to see a time series plot of the last five days of that observation. | |
| 87.3 °F | |
| 39.02 psu | |
| 0.15 ft | |
| TIME (EDT) |
WDIR |
WSPD kts |
GST kts |
WVHT ft |
DPD sec |
APD sec |
MWD |
PRES in |
PTDY in |
ATMP °F |
WTMP °F |
DEWP °F |
SAL psu |
VIS nmi |
TIDE ft |
|---|---|---|---|---|---|---|---|---|---|---|---|---|---|---|---|
| 2026-07-22 06:00 am | - | - | - | - | - | - | - | - | - | - | 87.3 | - | 38.96 | - | 0.12 |
| 2026-07-22 05:00 am | - | - | - | - | - | - | - | - | - | - | 87.6 | - | 38.96 | - | 0.09 |
| 2026-07-22 04:00 am | - | - | - | - | - | - | - | - | - | - | 87.6 | - | 38.94 | - | 0.10 |
| 2026-07-22 03:00 am | - | - | - | - | - | - | - | - | - | - | 87.8 | - | 38.96 | - | 0.07 |
| 2026-07-22 02:00 am | - | - | - | - | - | - | - | - | - | - | 88.0 | - | 39.00 | - | 0.07 |
| 2026-07-22 01:00 am | - | - | - | - | - | - | - | - | - | - | 88.2 | - | 39.01 | - | 0.08 |
| 2026-07-22 12:00 am | - | - | - | - | - | - | - | - | - | - | 88.5 | - | 39.02 | - | 0.10 |
| 2026-07-21 11:00 pm | - | - | - | - | - | - | - | - | - | - | 88.9 | - | 39.02 | - | 0.12 |
| 2026-07-21 10:00 pm | - | - | - | - | - | - | - | - | - | - | 89.4 | - | 39.01 | - | 0.14 |
| 2026-07-21 05:00 pm | - | - | - | - | - | - | - | - | - | - | 90.3 | - | 38.83 | - | 0.10 |
| 2026-07-21 04:00 pm | - | - | - | - | - | - | - | - | - | - | 90.0 | - | 38.84 | - | 0.10 |
| 2026-07-21 03:00 pm | - | - | - | - | - | - | - | - | - | - | 89.6 | - | 38.84 | - | 0.09 |
| 2026-07-21 02:00 pm | - | - | - | - | - | - | - | - | - | - | 88.9 | - | 38.83 | - | 0.09 |
| 2026-07-21 01:00 pm | - | - | - | - | - | - | - | - | - | - | 88.3 | - | 38.84 | - | 0.10 |
| 2026-07-21 12:00 pm | - | - | - | - | - | - | - | - | - | - | 87.8 | - | 38.87 | - | 0.12 |
| 2026-07-21 11:00 am | - | - | - | - | - | - | - | - | - | - | 87.3 | - | 38.90 | - | 0.13 |
| 2026-07-21 10:00 am | - | - | - | - | - | - | - | - | - | - | 86.9 | - | 38.94 | - | 0.15 |
| 2026-07-21 09:00 am | - | - | - | - | - | - | - | - | - | - | 86.7 | - | 38.99 | - | 0.19 |
| 2026-07-21 08:00 am | - | - | - | - | - | - | - | - | - | - | 86.7 | - | 39.07 | - | 0.19 |
|
These oceanographic data are displayed in rounded times. Click on the graph icon in the table below to see a time series plot of the last five days of that observation. | |
| Depth (DEPTH): | 4.9 ft |
| 87.31 °F | |
| 39.02 psu | |
| TIME (EDT) |
DEPTH ft |
OTMP °F |
COND mS/cm |
SAL psu |
O2% % |
O2PPM ppm |
CLCON ug/l |
TURB FTU |
PH |
EH mV |
|---|---|---|---|---|---|---|---|---|---|---|
| 2026-07-22 06:00 am | 4.9 | 87.28 | - | 38.96 | - | - | - | - | - | - |
| 2026-07-22 05:00 am | 4.9 | 87.57 | - | 38.96 | - | - | - | - | - | - |
| 2026-07-22 04:00 am | 4.9 | 87.64 | - | 38.94 | - | - | - | - | - | - |
| 2026-07-22 03:00 am | 4.9 | 87.82 | - | 38.96 | - | - | - | - | - | - |
| 2026-07-22 02:00 am | 4.9 | 88.03 | - | 39.00 | - | - | - | - | - | - |
| 2026-07-22 01:00 am | 4.9 | 88.23 | - | 39.01 | - | - | - | - | - | - |
| 2026-07-22 12:00 am | 4.9 | 88.54 | - | 39.02 | - | - | - | - | - | - |
| 2026-07-21 11:00 pm | 4.9 | 88.93 | - | 39.02 | - | - | - | - | - | - |
| 2026-07-21 10:00 pm | 4.9 | 89.47 | - | 39.01 | - | - | - | - | - | - |
| 2026-07-21 05:00 pm | 4.9 | 90.39 | - | 38.83 | - | - | - | - | - | - |
| 2026-07-21 04:00 pm | 4.9 | 90.01 | - | 38.84 | - | - | - | - | - | - |
| 2026-07-21 03:00 pm | 4.9 | 89.55 | - | 38.84 | - | - | - | - | - | - |
| 2026-07-21 02:00 pm | 4.9 | 88.95 | - | 38.83 | - | - | - | - | - | - |
| 2026-07-21 01:00 pm | 4.9 | 88.34 | - | 38.84 | - | - | - | - | - | - |
| 2026-07-21 12:00 pm | 4.9 | 87.71 | - | 38.87 | - | - | - | - | - | - |
| 2026-07-21 11:00 am | 4.9 | 87.22 | - | 38.90 | - | - | - | - | - | - |
| 2026-07-21 10:00 am | 4.9 | 86.85 | - | 38.94 | - | - | - | - | - | - |
| 2026-07-21 09:00 am | 4.9 | 86.63 | - | 38.99 | - | - | - | - | - | - |
| 2026-07-21 08:00 am | 4.9 | 86.76 | - | 39.07 | - | - | - | - | - | - |
|
Click on the graph icon in the table below to see a time series plot of the last five days of that observation. |
* indicates interpolated rain values |
| -------- Ten-minute Rain Rates (Centered at hour + minutes) --------- | ||||||||||||||
|---|---|---|---|---|---|---|---|---|---|---|---|---|---|---|
| TIME (EDT) |
Hourly Accum inches |
0 inches/hour | 10 inches/hour | 20 inches/hour | 30 inches/hour | 40 inches/hour | 50 inches/hour | |||||||
| 2026-07-22 07:00 am | 0.00 | - | - | - | - | - | - | |||||||
| 2026-07-22 06:00 am | 0.04 | - | - | - | - | - | - | |||||||
| 2026-07-22 05:00 am | 0.00 | - | - | - | - | - | - | |||||||
| 2026-07-22 04:00 am | 0.00 | - | - | - | - | - | - | |||||||
| 2026-07-22 03:00 am | 0.00 | - | - | - | - | - | - | |||||||
| 2026-07-22 02:00 am | 0.00 | - | - | - | - | - | - | |||||||
| 2026-07-22 01:00 am | 0.00 | - | - | - | - | - | - | |||||||
| 2026-07-22 12:00 am | 0.00 | - | - | - | - | - | - | |||||||
| 2026-07-21 11:00 pm | 0.00 | - | - | - | - | - | - | |||||||
| 2026-07-21 10:00 pm | 0.00 | - | - | - | - | - | - | |||||||
| 2026-07-21 05:00 pm | 0.00 | - | - | - | - | - | - | |||||||
| 2026-07-21 04:00 pm | 0.00 | - | - | - | - | - | - | |||||||
| 2026-07-21 03:00 pm | 0.00 | - | - | - | - | - | - | |||||||
| 2026-07-21 02:00 pm | 0.00 | - | - | - | - | - | - | |||||||
| 2026-07-21 01:00 pm | 0.00 | - | - | - | - | - | - | |||||||
| 2026-07-21 12:00 pm | 0.00 | - | - | - | - | - | - | |||||||
| 2026-07-21 11:00 am | 0.00 | - | - | - | - | - | - | |||||||
| 2026-07-21 10:00 am | 0.00 | - | - | - | - | - | - | |||||||
| 2026-07-21 09:00 am | 0.00 | - | - | - | - | - | - | |||||||
| 2026-07-21 08:00 am | 0.00 | - | - | - | - | - | - | |||||||
Links which are specific to this station are listed below:
Real Time Data in tabular form for the last forty-five days.
Historical data for this station can be requested by directly contacting the Everglades NPS at email: EVER_data_request@nps.gov