


![]() View the latest observations near East Pacific Hurricane Fausto and East Pacific Tropical Storm Genevieve.
View the latest observations near East Pacific Hurricane Fausto and East Pacific Tropical Storm Genevieve.
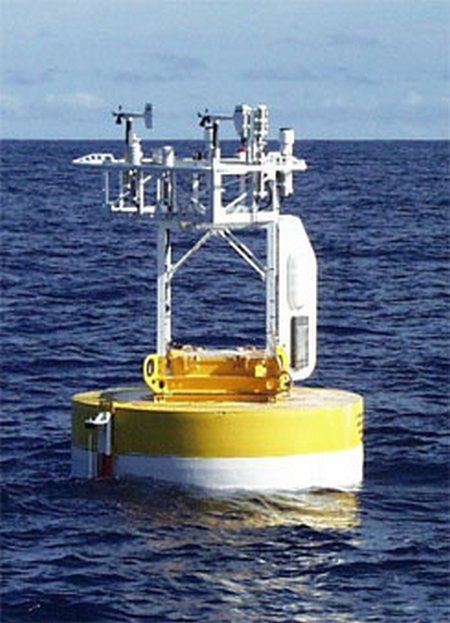
Station 51WH0 - WHOTS - Woods Hole Ocean Time-series 
Owned and maintained by Woods Hole Oceanographic Institution
Moored Buoy
WAMDAS payload
22.000 N 157.000 W (22°0'0" N 157°0'0" W)
Site elevation: sea level
Air temp height: 2.45 m above site elevation
Anemometer height: 2.66 m above site elevation
Barometer elevation: 2.43 m above mean sea level
Sea temp depth: 1.5 m below water line
Water depth: 4750 m
(24 hours for tsunami stations)
|
Click on the graph icon in the table below to see a time series plot of the last five days of that observation. | |
| ENE ( 60 deg true ) | |
| 15.5 kts | |
| 77.0 °F | |
| 78.6 °F | |
| 35.20 psu | |
| 72.1 °F | |
| 17.5 kts | |
| 19.4 kts | |
| TIME (HST) |
WDIR |
WSPD kts |
GST kts |
WVHT ft |
DPD sec |
APD sec |
MWD |
PRES in |
PTDY in |
ATMP °F |
WTMP °F |
DEWP °F |
SAL psu |
VIS nmi |
TIDE ft |
|---|---|---|---|---|---|---|---|---|---|---|---|---|---|---|---|
| 2026-07-24 05:30 pm | ENE | 17.5 | - | - | - | - | - | - | - | 77.2 | 78.6 | 72.0 | 35.20 | - | - |
| 2026-07-24 04:30 pm | E | 15.5 | - | - | - | - | - | - | - | 78.3 | 78.6 | 71.1 | 35.20 | - | - |
| 2026-07-24 03:30 pm | E | 15.5 | - | - | - | - | - | - | - | 78.3 | 78.6 | 70.7 | 35.20 | - | - |
| 2026-07-24 02:30 pm | E | 17.5 | - | - | - | - | - | - | - | 78.3 | 78.6 | 70.0 | 35.20 | - | - |
| 2026-07-24 01:30 pm | E | 17.5 | - | - | - | - | - | - | - | 78.1 | 78.6 | 70.0 | 35.20 | - | - |
| 2026-07-24 12:30 pm | E | 15.5 | - | - | - | - | - | - | - | 78.3 | 78.4 | 69.4 | 35.20 | - | - |
| 2026-07-24 11:30 am | E | 17.5 | - | - | - | - | - | - | - | 78.3 | 78.4 | 70.3 | 35.20 | - | - |
| 2026-07-24 10:30 am | E | 17.5 | - | - | - | - | - | - | - | 78.3 | 78.4 | 69.6 | 35.20 | - | - |
| 2026-07-24 09:30 am | ENE | 17.5 | - | - | - | - | - | - | - | 77.7 | 78.3 | 70.9 | 35.20 | - | - |
| 2026-07-24 08:30 am | ENE | 17.5 | - | - | - | - | - | - | - | 77.4 | 78.3 | 71.2 | 35.20 | - | - |
| 2026-07-24 07:30 am | E | 17.5 | - | - | - | - | - | - | - | 77.4 | 78.3 | 71.1 | 35.20 | - | - |
| 2026-07-24 06:30 am | E | 17.5 | - | - | - | - | - | - | - | 77.4 | 78.3 | 71.1 | 35.20 | - | - |
| 2026-07-24 05:30 am | E | 15.5 | - | - | - | - | - | - | - | 77.5 | 78.3 | 70.7 | 35.20 | - | - |
| 2026-07-24 04:30 am | E | 15.5 | - | - | - | - | - | - | - | 77.7 | 78.3 | 70.2 | 35.20 | - | - |
| 2026-07-24 03:30 am | ENE | 17.5 | - | - | - | - | - | 29.21 | - | 77.4 | 78.3 | 72.1 | 35.30 | - | - |
| 2026-07-24 02:30 am | E | 17.5 | - | - | - | - | - | - | - | 77.5 | 78.3 | 71.2 | 35.20 | - | - |
| 2026-07-24 01:30 am | E | 15.5 | - | - | - | - | - | - | - | 76.8 | 78.3 | 71.4 | 35.20 | - | - |
| 2026-07-24 12:30 am | E | 15.5 | - | - | - | - | - | - | - | 76.6 | 78.3 | 70.9 | 35.20 | - | - |
| 2026-07-23 11:30 pm | E | 15.5 | - | - | - | - | - | - | - | 77.4 | 78.4 | 71.2 | 35.20 | - | - |
| 2026-07-23 10:30 pm | E | 17.5 | - | - | - | - | - | - | - | 77.4 | 78.4 | 71.4 | 35.20 | - | - |
| 2026-07-23 09:30 pm | ENE | 17.5 | - | - | - | - | - | 29.26 | - | 77.9 | 78.4 | 72.5 | 35.30 | - | - |
| 2026-07-23 08:30 pm | E | 17.5 | - | - | - | - | - | - | - | 77.7 | 78.4 | 71.2 | 35.20 | - | - |
| 2026-07-23 07:30 pm | E | 17.5 | - | - | - | - | - | - | - | 77.7 | 78.4 | 71.2 | 35.20 | - | - |
|
These oceanographic data are displayed in rounded times. Click on the graph icon in the table below to see a time series plot of the last five days of that observation. | |
| Depth (DEPTH): | 3.3 ft |
| 78.62 °F | |
| 35.20 psu | |
| TIME (HST) |
DEPTH ft |
OTMP °F |
COND mS/cm |
SAL psu |
O2% % |
O2PPM ppm |
CLCON ug/l |
TURB FTU |
PH |
EH mV |
|---|---|---|---|---|---|---|---|---|---|---|
| 2026-07-24 05:30 pm | 3.3 | 78.62 | - | 35.20 | - | - | - | - | - | - |
| 2026-07-24 04:30 pm | 3.3 | 78.62 | - | 35.20 | - | - | - | - | - | - |
| 2026-07-24 03:30 pm | 3.3 | 78.62 | - | 35.20 | - | - | - | - | - | - |
| 2026-07-24 02:30 pm | 3.3 | 78.62 | - | 35.20 | - | - | - | - | - | - |
| 2026-07-24 01:30 pm | 3.3 | 78.62 | - | 35.20 | - | - | - | - | - | - |
| 2026-07-24 12:30 pm | 3.3 | 78.44 | - | 35.20 | - | - | - | - | - | - |
| 2026-07-24 11:30 am | 3.3 | 78.44 | - | 35.20 | - | - | - | - | - | - |
| 2026-07-24 10:30 am | 3.3 | 78.44 | - | 35.20 | - | - | - | - | - | - |
| 2026-07-24 09:30 am | 3.3 | 78.26 | - | 35.20 | - | - | - | - | - | - |
| 2026-07-24 08:30 am | 3.3 | 78.26 | - | 35.20 | - | - | - | - | - | - |
| 2026-07-24 07:30 am | 3.3 | 78.26 | - | 35.20 | - | - | - | - | - | - |
| 2026-07-24 06:30 am | 3.3 | 78.26 | - | 35.20 | - | - | - | - | - | - |
| 2026-07-24 05:30 am | 3.3 | 78.26 | - | 35.20 | - | - | - | - | - | - |
| 2026-07-24 04:30 am | 3.3 | 78.26 | - | 35.20 | - | - | - | - | - | - |
| 2026-07-24 03:30 am | 3.3 | 78.26 | - | 35.30 | - | - | - | - | - | - |
| 2026-07-24 02:30 am | 3.3 | 78.26 | - | 35.20 | - | - | - | - | - | - |
| 2026-07-24 01:30 am | 3.3 | 78.26 | - | 35.20 | - | - | - | - | - | - |
| 2026-07-24 12:30 am | 3.3 | 78.26 | - | 35.20 | - | - | - | - | - | - |
| 2026-07-23 11:30 pm | 3.3 | 78.44 | - | 35.20 | - | - | - | - | - | - |
| 2026-07-23 10:30 pm | 3.3 | 78.44 | - | 35.20 | - | - | - | - | - | - |
| 2026-07-23 09:30 pm | 3.3 | 78.44 | - | 35.30 | - | - | - | - | - | - |
| 2026-07-23 08:30 pm | 3.3 | 78.44 | - | 35.20 | - | - | - | - | - | - |
| 2026-07-23 07:30 pm | 3.3 | 78.44 | - | 35.20 | - | - | - | - | - | - |
|
Click on the graph icon in the table below to see a time series plot of the last five days of that observation. | ||
| 93.9 | watts/meter2 | |
| 394.5 | watts/meter2 | |
| TIME (HST) |
SRAD1 w/m2 |
SRAD2 w/m2 |
LRAD w/m2 |
|---|---|---|---|
| 2026-07-24 05:30 pm | - | 372.2 | 384.9 |
| 2026-07-24 04:30 pm | - | 541.9 | 395.1 |
| 2026-07-24 03:30 pm | - | 735.9 | 384.5 |
| 2026-07-24 02:30 pm | - | 882.5 | 388.3 |
| 2026-07-24 01:30 pm | - | 1051.5 | 380.5 |
| 2026-07-24 12:30 pm | - | 1052.1 | 381.9 |
| 2026-07-24 11:30 am | - | 964.7 | 381.0 |
| 2026-07-24 10:30 am | - | 824.9 | 376.1 |
| 2026-07-24 09:30 am | - | 569.9 | 386.2 |
| 2026-07-24 08:30 am | - | 323.3 | 391.3 |
| 2026-07-24 07:30 am | - | 132.8 | 411.3 |
| 2026-07-24 06:30 am | - | 34.1 | 416.9 |
| 2026-07-24 05:30 am | - | 8.4 | 393.6 |
| 2026-07-24 04:30 am | - | 8.3 | 383.7 |
| 2026-07-24 03:30 am | - | 3.3 | 388.5 |
| 2026-07-24 02:30 am | - | 8.5 | 402.6 |
| 2026-07-24 01:30 am | - | 8.3 | 420.4 |
| 2026-07-24 12:30 am | - | 8.7 | 422.1 |
| 2026-07-23 11:30 pm | - | 8.4 | 401.1 |
| 2026-07-23 10:30 pm | - | 8.1 | 406.5 |
| 2026-07-23 09:30 pm | - | 3.1 | 399.8 |
| 2026-07-23 08:30 pm | - | 8.2 | 399.8 |
| 2026-07-23 07:30 pm | - | 12.6 | 408.3 |
Links which are specific to this station are listed below:
Real Time Data in tabular form for the last forty-five days.
Historical Data & Climatic Summaries for quality controlled data for prior months and years.