


Station 46029 (LLNR 688) - COLUMBIA RIVER BAR - 20NM West of Columbia River Mouth 
Owned and maintained by National Data Buoy Center
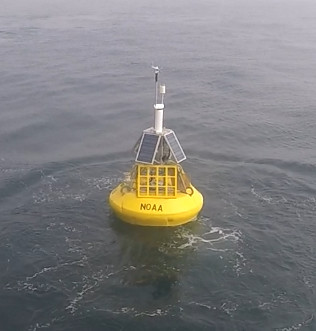
2.1-meter ionomer foam buoy w/ seal cage
SCOOP payload
46.148 N 124.508 W (46°8'54" N 124°30'30" W)
Site elevation: sea level
Air temp height: 2.8 m above site elevation
Anemometer height: 3.2 m above site elevation
Barometer elevation: 1.8 m above mean sea level
Sea temp depth: 1.1 m below water line
Water depth: 135 m
Watch circle radius: 225 yards
(24 hours for tsunami stations)

|
Click on the graph icon in the table below to see a time series plot of the last five days of that observation. | |
| NNE ( 20 deg true ) | |
| 5.8 kts | |
| 7.8 kts | |
| 30.10 in | |
| 60.6 °F | |
| 59.0 °F | |
| 58.3 °F | |
| 5.8 kts | |
| 7.8 kts | |
|
||||||||||||||||||
| TIME (PDT) |
WDIR |
WSPD kts |
GST kts |
WVHT ft |
DPD sec |
APD sec |
MWD |
PRES in |
PTDY in |
ATMP °F |
WTMP °F |
DEWP °F |
SAL psu |
VIS nmi |
TIDE ft |
|---|---|---|---|---|---|---|---|---|---|---|---|---|---|---|---|
| 2026-06-14 09:30 am | N | 5.8 | 5.8 | - | - | - | - | 30.10 | - | 60.6 | 59.0 | 58.3 | - | - | - |
| 2026-06-14 09:20 am | N | 5.8 | 5.8 | 3.0 | 6 | 4.9 | NW | 30.10 | - | 60.6 | 58.8 | 58.1 | - | - | - |
| 2026-06-14 09:10 am | N | 5.8 | 7.8 | 3.0 | - | 4.9 | NW | 30.11 | - | 60.6 | 58.6 | 57.9 | - | - | - |
| 2026-06-14 09:00 am | NNE | 5.8 | 5.8 | - | - | - | - | 30.10 | +0.02 | 60.6 | 58.6 | 57.9 | - | - | - |
| 2026-06-14 08:50 am | NNE | 5.8 | 7.8 | 3.0 | 17 | 4.9 | SSE | 30.10 | - | 60.6 | 58.6 | 57.9 | - | - | - |
| 2026-06-14 08:40 am | NNE | 5.8 | 7.8 | 3.0 | - | 4.9 | SSE | 30.10 | - | 60.6 | 58.5 | 57.9 | - | - | - |
| 2026-06-14 08:30 am | NNE | 5.8 | 7.8 | - | - | - | - | 30.11 | - | 60.6 | 58.5 | 57.7 | - | - | - |
| 2026-06-14 08:20 am | NNE | 7.8 | 7.8 | 3.0 | 17 | 4.9 | NE | 30.10 | - | 60.6 | - | 57.7 | - | - | - |
| 2026-06-14 08:10 am | NNE | 7.8 | 7.8 | 3.0 | - | 4.9 | NE | 30.10 | - | 60.4 | 58.5 | 57.7 | - | - | - |
| 2026-06-14 08:00 am | NNE | 7.8 | 7.8 | - | - | - | - | 30.10 | +0.02 | 60.4 | 58.3 | 57.7 | - | - | - |
| 2026-06-14 07:50 am | NNE | 7.8 | 7.8 | 3.3 | 6 | 4.7 | NW | 30.10 | - | 60.4 | 58.3 | 57.9 | - | - | - |
| 2026-06-14 07:40 am | NNE | 5.8 | 7.8 | - | - | - | - | 30.10 | - | 60.4 | 58.3 | 57.7 | - | - | - |
| 2026-06-14 07:30 am | NNE | 7.8 | 7.8 | - | - | - | - | 30.10 | - | 60.4 | 58.3 | 57.7 | - | - | - |
| 2026-06-14 07:20 am | NNE | 7.8 | 7.8 | 3.0 | 6 | 4.7 | NW | 30.10 | - | 60.4 | 58.3 | 57.7 | - | - | - |
| 2026-06-14 07:10 am | NNE | 7.8 | 9.7 | 3.0 | - | 4.7 | NW | 30.09 | - | 60.6 | 58.3 | 57.9 | - | - | - |
| 2026-06-14 07:00 am | NNE | 7.8 | 9.7 | - | - | - | - | 30.09 | +0.02 | 60.6 | 58.3 | 57.7 | - | - | - |
| 2026-06-14 06:50 am | NNE | 7.8 | 7.8 | 3.3 | 5 | 4.6 | NNW | 30.09 | - | 60.6 | 58.3 | 57.9 | - | - | - |
| 2026-06-14 06:40 am | NNE | 7.8 | 9.7 | - | - | - | - | 30.09 | - | 60.6 | 58.3 | 57.9 | - | - | - |
| 2026-06-14 06:30 am | NNE | 7.8 | 9.7 | - | - | - | - | 30.09 | - | 60.4 | 58.3 | 58.1 | - | - | - |
| 2026-06-14 06:20 am | N | 7.8 | 9.7 | 3.3 | 6 | 4.6 | NW | 30.09 | - | 60.4 | 58.3 | 58.1 | - | - | - |
| 2026-06-14 06:10 am | N | 9.7 | 9.7 | 3.3 | - | 4.6 | NW | 30.08 | - | 60.6 | 58.3 | 58.3 | - | - | - |
| 2026-06-14 06:00 am | N | 9.7 | 11.7 | - | - | - | - | 30.08 | +0.01 | 60.4 | 58.3 | 58.3 | - | - | - |
| 2026-06-14 05:50 am | N | 9.7 | 11.7 | 3.3 | 6 | 4.5 | NW | 30.08 | - | 60.4 | 58.3 | 58.3 | - | - | - |
| 2026-06-14 05:40 am | N | 9.7 | 11.7 | - | - | - | - | 30.08 | - | 60.3 | 58.3 | 58.3 | - | - | - |
| 2026-06-14 05:30 am | N | 11.7 | 13.6 | - | - | - | - | 30.08 | - | 60.3 | 58.3 | 58.3 | - | - | - |
| 2026-06-14 05:20 am | N | 11.7 | 13.6 | 3.0 | 6 | 4.3 | NW | 30.08 | - | 60.3 | 58.5 | 58.3 | - | - | - |
| 2026-06-14 05:10 am | N | 11.7 | 11.7 | 3.0 | - | 4.3 | NW | 30.08 | - | 60.1 | 58.5 | 58.5 | - | - | - |
| 2026-06-14 05:00 am | N | 11.7 | 13.6 | - | - | - | - | 30.08 | +0.01 | 60.1 | 58.5 | 58.5 | - | - | - |
| 2026-06-14 04:50 am | N | 11.7 | 13.6 | 3.3 | 7 | 4.5 | NW | 30.07 | - | 60.1 | 58.5 | 58.5 | - | - | - |
| 2026-06-14 04:40 am | N | 11.7 | 13.6 | - | - | - | - | 30.07 | - | 60.1 | 58.5 | 58.5 | - | - | - |
| 2026-06-14 04:30 am | N | 11.7 | 13.6 | - | - | - | - | 30.07 | - | 60.1 | 58.5 | 58.5 | - | - | - |
| 2026-06-14 04:20 am | N | 11.7 | 13.6 | 3.3 | 7 | 4.4 | NW | 30.07 | - | 59.9 | 58.5 | 58.3 | - | - | - |
| 2026-06-14 04:10 am | N | 11.7 | 13.6 | 3.3 | - | 4.4 | NW | 30.07 | - | 60.1 | 58.5 | 58.5 | - | - | - |
| 2026-06-14 04:00 am | N | 11.7 | 13.6 | - | - | - | - | 30.07 | +0.00 | 60.3 | 58.5 | 58.6 | - | - | - |
| 2026-06-14 03:50 am | N | 11.7 | 13.6 | 3.3 | 6 | 4.5 | NW | 30.07 | - | 60.3 | 58.5 | 58.6 | - | - | - |
| 2026-06-14 03:40 am | N | 11.7 | 13.6 | 3.3 | - | 4.5 | NW | 30.07 | - | 60.3 | 58.6 | 58.6 | - | - | - |
| 2026-06-14 03:30 am | N | 9.7 | 11.7 | - | - | - | - | 30.07 | - | 60.4 | 58.6 | 58.5 | - | - | - |
| 2026-06-14 03:20 am | N | 9.7 | 11.7 | 3.3 | 6 | 4.5 | NW | 30.07 | - | 60.3 | 58.6 | 58.3 | - | - | - |
| 2026-06-14 03:10 am | N | 9.7 | 11.7 | 3.3 | - | 4.5 | NW | 30.07 | - | 60.3 | 58.6 | 58.5 | - | - | - |
| 2026-06-14 03:00 am | N | 9.7 | 11.7 | - | - | - | - | 30.07 | -0.01 | 60.4 | 58.6 | 58.6 | - | - | - |
| 2026-06-14 02:50 am | N | 9.7 | 11.7 | 3.3 | 6 | 4.7 | NW | 30.07 | - | 60.4 | 58.6 | 58.5 | - | - | - |
| 2026-06-14 02:40 am | N | 9.7 | 11.7 | - | - | - | - | 30.07 | - | 60.3 | 58.6 | 58.5 | - | - | - |
| 2026-06-14 02:30 am | N | 9.7 | 11.7 | - | - | - | - | 30.07 | - | 60.6 | 58.8 | 58.6 | - | - | - |
| 2026-06-14 02:20 am | N | 9.7 | 11.7 | 3.3 | 7 | 4.6 | NW | 30.07 | - | 60.6 | 58.8 | 58.3 | - | - | - |
| 2026-06-14 02:10 am | N | 9.7 | 11.7 | - | - | - | - | 30.07 | - | 60.8 | 58.8 | 58.1 | - | - | - |
| 2026-06-14 02:00 am | N | 11.7 | 13.6 | - | - | - | - | 30.07 | -0.01 | 61.0 | 58.8 | 58.3 | - | - | - |
| 2026-06-14 01:50 am | N | 11.7 | 13.6 | 3.3 | 5 | 4.6 | NW | 30.07 | - | 61.0 | 59.0 | 58.3 | - | - | - |
| 2026-06-14 01:40 am | N | 11.7 | 13.6 | - | - | - | - | 30.07 | - | 61.0 | 58.8 | 58.3 | - | - | - |
| 2026-06-14 01:30 am | N | 11.7 | 13.6 | - | - | - | - | 30.07 | - | 61.0 | 59.0 | 58.3 | - | - | - |
| 2026-06-14 01:20 am | N | 9.7 | 11.7 | 3.3 | 7 | 4.8 | NNW | 30.07 | - | 60.8 | 59.0 | 58.1 | - | - | - |
| 2026-06-14 01:10 am | N | 9.7 | 11.7 | 3.3 | - | 4.8 | NNW | 30.07 | - | 61.0 | 59.0 | 58.3 | - | - | - |
| 2026-06-14 01:00 am | N | 11.7 | 11.7 | - | - | - | - | 30.07 | -0.01 | 61.0 | 59.0 | 58.1 | - | - | - |
| 2026-06-14 12:50 am | N | 11.7 | 11.7 | 3.6 | 7 | 4.8 | NW | 30.07 | - | 61.0 | 59.2 | 58.1 | - | - | - |
| 2026-06-14 12:40 am | N | 11.7 | 13.6 | - | - | - | - | 30.07 | - | 60.8 | 59.2 | 57.9 | - | - | - |
| 2026-06-14 12:30 am | N | 11.7 | 11.7 | - | - | - | - | 30.07 | - | 60.8 | 59.2 | 58.1 | - | - | - |
| 2026-06-14 12:20 am | N | 11.7 | 11.7 | 3.6 | 4 | 4.6 | NNW | 30.07 | - | 60.6 | 59.2 | 57.9 | - | - | - |
| 2026-06-14 12:10 am | N | 9.7 | 11.7 | 3.6 | - | 4.6 | NNW | 30.07 | - | 60.8 | 59.0 | 57.7 | - | - | - |
| 2026-06-14 12:00 am | N | 11.7 | 13.6 | - | - | - | - | 30.08 | +0.00 | 60.8 | 59.2 | 57.7 | - | - | - |
| 2026-06-13 11:50 pm | N | 11.7 | 13.6 | 3.6 | 7 | 4.7 | NW | 30.08 | - | 61.0 | 59.2 | 57.7 | - | - | - |
| 2026-06-13 11:40 pm | NNE | 11.7 | 13.6 | - | - | - | - | 30.08 | - | 61.0 | 59.2 | 57.6 | - | - | - |
| 2026-06-13 11:30 pm | NNE | 11.7 | 13.6 | - | - | - | - | 30.08 | - | 61.0 | 59.2 | 57.6 | - | - | - |
| 2026-06-13 11:20 pm | NNE | 11.7 | 13.6 | 3.6 | 6 | 4.6 | NW | 30.08 | - | 61.0 | 59.2 | 57.6 | - | - | - |
| 2026-06-13 11:10 pm | NNE | 11.7 | 13.6 | 3.6 | - | 4.6 | NW | 30.09 | - | 61.0 | 59.0 | 57.4 | - | - | - |
| 2026-06-13 11:00 pm | NNE | 11.7 | 11.7 | - | - | - | - | 30.09 | +0.01 | 61.0 | 59.0 | 57.6 | - | - | - |
| 2026-06-13 10:50 pm | NNE | 11.7 | 13.6 | 3.6 | 6 | 4.5 | NW | 30.08 | - | 61.2 | 59.2 | 57.6 | - | - | - |
| 2026-06-13 10:40 pm | NNE | 11.7 | 13.6 | - | - | - | - | 30.09 | - | 61.0 | 59.0 | 57.7 | - | - | - |
| 2026-06-13 10:30 pm | NNE | 11.7 | 13.6 | - | - | - | - | 30.09 | - | 61.0 | 59.2 | 57.7 | - | - | - |
| 2026-06-13 10:20 pm | NNE | 11.7 | 13.6 | 3.9 | 7 | 4.6 | NW | 30.09 | - | 61.0 | 59.2 | 57.7 | - | - | - |
| 2026-06-13 10:10 pm | NNE | 11.7 | 13.6 | 3.9 | - | 4.6 | NW | 30.09 | - | 61.2 | 59.2 | 57.6 | - | - | - |
| 2026-06-13 10:00 pm | NNE | 13.6 | 15.5 | - | - | - | - | 30.09 | +0.01 | 61.5 | 59.2 | 57.4 | - | - | - |
| 2026-06-13 09:50 pm | NNE | 13.6 | 15.5 | 3.9 | 7 | 4.6 | NW | 30.09 | - | 61.7 | 59.2 | 57.2 | - | - | - |
| 2026-06-13 09:40 pm | NNE | 13.6 | 15.5 | - | - | - | - | 30.09 | - | 61.7 | 59.2 | 57.2 | - | - | - |
| 2026-06-13 09:30 pm | N | 13.6 | 15.5 | - | - | - | - | 30.08 | - | 61.9 | 59.2 | 57.0 | - | - | - |
| 2026-06-13 09:20 pm | N | 15.5 | 19.4 | 3.9 | 7 | 4.5 | NNW | 30.08 | - | 62.1 | 59.0 | 57.0 | - | - | - |
| 2026-06-13 09:10 pm | N | 15.5 | 19.4 | 3.9 | - | 4.5 | NNW | 30.08 | - | 62.1 | 59.2 | 56.8 | - | - | - |
| 2026-06-13 09:00 pm | N | 15.5 | 19.4 | - | - | - | - | 30.07 | -0.01 | 62.2 | 59.2 | 56.8 | - | - | - |
| 2026-06-13 08:50 pm | N | 17.5 | 19.4 | 4.3 | 8 | 4.6 | WNW | 30.07 | - | 62.2 | 59.4 | 56.8 | - | - | - |
| 2026-06-13 08:40 pm | N | 17.5 | 19.4 | - | - | - | - | 30.07 | - | 62.2 | 59.4 | 57.0 | - | - | - |
| 2026-06-13 08:30 pm | N | 17.5 | 19.4 | - | - | - | - | 30.07 | - | 62.2 | 59.4 | 57.0 | - | - | - |
| 2026-06-13 08:20 pm | N | 17.5 | 21.4 | 4.6 | 7 | 4.6 | NNW | 30.07 | - | 62.2 | 59.4 | 56.8 | - | - | - |
| 2026-06-13 08:10 pm | N | 17.5 | 21.4 | 4.6 | - | 4.6 | NNW | 30.07 | - | 62.1 | 59.2 | 57.0 | - | - | - |
| 2026-06-13 08:00 pm | N | 17.5 | 21.4 | - | - | - | - | 30.07 | -0.02 | 62.1 | 59.2 | 57.0 | - | - | - |
| 2026-06-13 07:50 pm | N | 17.5 | 21.4 | 4.6 | 8 | 4.7 | NW | 30.07 | - | 61.9 | 59.2 | 56.8 | - | - | - |
| 2026-06-13 07:40 pm | N | 17.5 | 19.4 | 4.6 | - | 4.7 | NW | 30.07 | - | 62.1 | 59.0 | 56.7 | - | - | - |
| 2026-06-13 07:30 pm | N | 17.5 | 21.4 | - | - | - | - | 30.07 | - | 62.1 | 59.2 | 56.7 | - | - | - |
| 2026-06-13 07:20 pm | N | 17.5 | 21.4 | 4.6 | 6 | 4.4 | NNW | 30.07 | - | 62.2 | 59.2 | 56.7 | - | - | - |
| 2026-06-13 07:10 pm | N | 17.5 | 21.4 | 4.6 | - | 4.4 | NNW | 30.07 | - | 62.1 | 59.0 | 56.7 | - | - | - |
| 2026-06-13 07:00 pm | N | 17.5 | 21.4 | - | - | - | - | 30.07 | -0.04 | 62.4 | 59.2 | 56.5 | - | - | - |
| 2026-06-13 06:50 pm | N | 17.5 | 21.4 | 4.6 | 7 | 4.7 | NW | 30.07 | - | 62.6 | 59.2 | 56.3 | - | - | - |
| 2026-06-13 06:40 pm | N | 17.5 | 21.4 | - | - | - | - | 30.08 | - | 62.6 | 59.2 | 56.5 | - | - | - |
| 2026-06-13 06:30 pm | N | 17.5 | 21.4 | - | - | - | - | 30.08 | - | 62.6 | 59.2 | 56.7 | - | - | - |
| 2026-06-13 06:20 pm | N | 17.5 | 19.4 | 5.2 | 7 | 5.0 | NNW | 30.08 | - | 62.1 | 59.2 | 57.0 | - | - | - |
| 2026-06-13 06:10 pm | N | 17.5 | 21.4 | - | - | - | - | 30.08 | - | 61.7 | 59.2 | 57.4 | - | - | - |
| 2026-06-13 06:00 pm | N | 17.5 | 19.4 | - | - | - | - | 30.08 | -0.04 | 61.5 | 59.2 | 57.6 | - | - | - |
| 2026-06-13 05:50 pm | N | 17.5 | 21.4 | 4.6 | 7 | 4.7 | NW | 30.08 | - | 61.2 | 59.2 | 57.0 | - | - | - |
| 2026-06-13 05:40 pm | N | 17.5 | 21.4 | - | - | - | - | 30.08 | - | 60.8 | 59.4 | 57.2 | - | - | - |
| 2026-06-13 05:30 pm | N | 17.5 | 21.4 | - | - | - | - | 30.08 | - | 60.6 | 59.2 | 57.6 | - | - | - |
| 2026-06-13 05:20 pm | NNW | 17.5 | 21.4 | 4.6 | 7 | 4.8 | NNW | 30.09 | - | 60.6 | 59.2 | 57.7 | - | - | - |
| 2026-06-13 05:10 pm | NNW | 17.5 | 21.4 | 4.6 | - | 4.8 | NNW | 30.09 | - | 60.4 | 59.0 | 57.6 | - | - | - |
| 2026-06-13 05:00 pm | NNW | 17.5 | 21.4 | - | - | - | - | 30.09 | -0.04 | 60.4 | 59.2 | 57.9 | - | - | - |
| 2026-06-13 04:50 pm | NNW | 17.5 | 19.4 | 4.9 | 7 | 5.0 | NNW | 30.10 | - | 60.3 | 59.2 | 57.9 | - | - | - |
| 2026-06-13 04:40 pm | N | 17.5 | 19.4 | - | - | - | - | 30.10 | - | 59.9 | 59.0 | 57.9 | - | - | - |
| 2026-06-13 04:30 pm | N | 17.5 | 21.4 | - | - | - | - | 30.10 | - | 59.7 | 59.0 | 57.9 | - | - | - |
| 2026-06-13 04:20 pm | NNW | 17.5 | 21.4 | 4.6 | 7 | 4.8 | NW | 30.11 | - | 59.5 | - | 57.9 | - | - | - |
| 2026-06-13 04:10 pm | NNW | 17.5 | 21.4 | 4.6 | - | 4.8 | NW | 30.11 | - | 59.5 | 58.8 | 57.9 | - | - | - |
| 2026-06-13 04:00 pm | NNW | 17.5 | 21.4 | - | - | - | - | 30.11 | -0.03 | 59.7 | 58.8 | 58.1 | - | - | - |
| 2026-06-13 03:50 pm | NNW | 17.5 | 19.4 | 4.6 | 7 | 4.9 | NNW | 30.11 | - | 59.9 | 59.0 | 57.9 | - | - | - |
| 2026-06-13 03:40 pm | NNW | 17.5 | 19.4 | - | - | - | - | 30.11 | - | 60.1 | 59.0 | 57.6 | - | - | - |
| 2026-06-13 03:30 pm | NNW | 17.5 | 19.4 | - | - | - | - | 30.11 | - | 60.1 | 59.0 | 57.6 | - | - | - |
| 2026-06-13 03:20 pm | NNW | 15.5 | 19.4 | 4.6 | 7 | 5.1 | NNW | 30.11 | - | 59.9 | 59.0 | 57.7 | - | - | - |
| 2026-06-13 03:10 pm | NNW | 15.5 | 19.4 | 4.6 | - | 5.1 | NNW | 30.12 | - | 59.7 | 59.0 | 57.9 | - | - | - |
| 2026-06-13 03:00 pm | NNW | 15.5 | 17.5 | - | - | - | - | 30.12 | -0.02 | 59.9 | 59.0 | 57.9 | - | - | - |
| 2026-06-13 02:50 pm | N | 15.5 | 19.4 | 4.3 | 8 | 4.8 | WNW | 30.12 | - | 59.9 | 59.0 | 57.7 | - | - | - |
| 2026-06-13 02:40 pm | N | 15.5 | 17.5 | - | - | - | - | 30.12 | - | 60.1 | 59.0 | 58.1 | - | - | - |
| 2026-06-13 02:30 pm | N | 15.5 | 19.4 | - | - | - | - | 30.12 | - | 60.1 | 59.0 | 57.9 | - | - | - |
| 2026-06-13 02:20 pm | N | 15.5 | 17.5 | 4.3 | 7 | 4.9 | NW | 30.12 | - | 60.3 | 58.8 | 57.9 | - | - | - |
| 2026-06-13 02:10 pm | N | 15.5 | 17.5 | - | - | - | - | 30.13 | - | 60.3 | 58.8 | 57.7 | - | - | - |
| 2026-06-13 02:00 pm | N | 15.5 | 17.5 | - | - | - | - | 30.13 | -0.01 | 60.3 | 58.8 | 57.6 | - | - | - |
| 2026-06-13 01:50 pm | N | 15.5 | 17.5 | 4.3 | 7 | 5.0 | NW | 30.13 | - | 60.3 | 58.8 | 57.6 | - | - | - |
| 2026-06-13 01:40 pm | N | 15.5 | 17.5 | 4.3 | - | 5.0 | NW | 30.13 | - | 60.1 | 58.8 | 57.6 | - | - | - |
| 2026-06-13 01:30 pm | N | 15.5 | 17.5 | - | - | - | - | 30.14 | - | 60.1 | 58.8 | 57.7 | - | - | - |
| 2026-06-13 01:20 pm | N | 15.5 | 17.5 | 3.9 | 7 | 4.9 | NW | 30.14 | - | 60.1 | 59.0 | 57.6 | - | - | - |
| 2026-06-13 01:10 pm | N | 15.5 | 17.5 | - | - | - | - | 30.14 | - | 59.9 | 58.8 | 57.6 | - | - | - |
| 2026-06-13 01:00 pm | N | 15.5 | 17.5 | - | - | - | - | 30.14 | -0.01 | 59.7 | 58.8 | 57.6 | - | - | - |
| 2026-06-13 12:50 pm | N | 15.5 | 17.5 | 3.6 | - | 4.9 | NW | 30.14 | - | 59.5 | 58.8 | 57.7 | - | - | - |
| 2026-06-13 12:40 pm | - | - | - | 3.6 | 7 | 4.9 | NW | - | - | - | - | - | - | - | - |
| 2026-06-13 12:30 pm | N | 13.6 | 15.5 | - | - | - | - | 30.14 | - | 59.4 | 58.8 | 57.7 | - | - | - |
| 2026-06-13 12:20 pm | N | 13.6 | 15.5 | 3.9 | 7 | 5.0 | WNW | 30.14 | - | 59.7 | 58.8 | 57.7 | - | - | - |
| 2026-06-13 12:10 pm | N | 13.6 | 17.5 | 3.9 | - | 5.0 | WNW | 30.14 | - | 60.1 | 58.8 | 57.4 | - | - | - |
| 2026-06-13 12:00 pm | N | 13.6 | 15.5 | - | - | - | - | 30.14 | -0.01 | 60.4 | 58.8 | 57.4 | - | - | - |
| 2026-06-13 11:50 am | N | 13.6 | 15.5 | 3.9 | 7 | 5.1 | NW | 30.14 | - | 60.8 | 58.8 | 57.2 | - | - | - |
| 2026-06-13 11:40 am | N | 13.6 | 15.5 | - | - | - | - | 30.14 | - | 60.8 | 58.6 | 57.2 | - | - | - |
| 2026-06-13 11:30 am | N | 13.6 | 15.5 | - | - | - | - | 30.14 | - | 60.4 | 58.6 | 57.0 | - | - | - |
| 2026-06-13 11:20 am | N | 13.6 | 15.5 | 3.9 | 7 | 5.0 | NW | 30.14 | - | 60.4 | 58.5 | 57.0 | - | - | - |
| 2026-06-13 11:10 am | N | 13.6 | 15.5 | 3.9 | - | 5.0 | NW | 30.14 | - | 60.1 | 58.5 | 56.8 | - | - | - |
| 2026-06-13 11:00 am | N | 13.6 | 15.5 | - | - | - | - | 30.14 | -0.01 | 59.9 | 58.5 | 56.7 | - | - | - |
| 2026-06-13 10:50 am | N | 13.6 | 15.5 | 3.9 | 7 | 5.0 | NW | 30.15 | - | 59.9 | 58.5 | 56.8 | - | - | - |
| 2026-06-13 10:40 am | N | 13.6 | 15.5 | - | - | - | - | 30.15 | - | 59.7 | 58.5 | 56.7 | - | - | - |
| 2026-06-13 10:30 am | N | 13.6 | 15.5 | - | - | - | - | 30.15 | - | 59.5 | 58.3 | 56.8 | - | - | - |
| 2026-06-13 10:20 am | N | 13.6 | 15.5 | 3.9 | 7 | 5.1 | NW | 30.15 | - | 59.4 | 58.3 | 56.8 | - | - | - |
| 2026-06-13 10:10 am | N | 13.6 | 15.5 | 3.9 | - | 5.1 | NW | 30.15 | - | 59.4 | 58.3 | 57.2 | - | - | - |
| 2026-06-13 10:00 am | N | 13.6 | 15.5 | - | - | - | - | 30.15 | -0.02 | 59.0 | 58.3 | 57.0 | - | - | - |
| 2026-06-13 09:50 am | N | 13.6 | 15.5 | 3.9 | 7 | 5.1 | NW | 30.15 | - | 58.8 | 58.3 | 57.2 | - | - | - |
|
These wave data are displayed in rounded times. Click on the graph icon in the table below to see a time series plot of the last five days of that observation. | |
| 3.0 ft | |
| 2.6 ft | |
| 5.9 sec | |
| NW | |
| 1.3 ft | |
| 4.0 sec | |
| NNW | |
| STEEP | |
| 4.9 sec | |
| TIME (PDT) |
WVHT ft |
SwH ft |
SwP sec |
SwD |
WWH ft |
WWP sec |
WWD |
STEEPNESS |
APD sec |
|---|---|---|---|---|---|---|---|---|---|
| 2026-06-14 08:40 am | 3.0 | 2.6 | 17.4 | SSE | 1.3 | 4.0 | NNW | SWELL | 4.9 |
| 2026-06-14 08:10 am | 3.0 | 2.6 | 17.4 | NE | 1.3 | 3.8 | NNW | SWELL | 4.9 |
| 2026-06-14 07:40 am | 3.3 | 3.0 | 6.2 | NW | 1.6 | 3.7 | NNW | STEEP | 4.7 |
| 2026-06-14 07:10 am | 3.0 | 2.6 | 6.2 | NW | 1.3 | 3.7 | NW | STEEP | 4.7 |
| 2026-06-14 06:40 am | 3.3 | 3.0 | 4.8 | NNW | 1.6 | 4.0 | NW | VERY_STEEP | 4.6 |
| 2026-06-14 06:10 am | 3.3 | 2.6 | 6.2 | NW | 2.0 | 4.3 | NNW | STEEP | 4.6 |
| 2026-06-14 05:40 am | 3.3 | 2.3 | 6.2 | NW | 2.3 | 4.8 | NNW | STEEP | 4.5 |
| 2026-06-14 05:10 am | 3.0 | 2.0 | 6.2 | NW | 2.3 | 5.0 | NW | STEEP | 4.3 |
| 2026-06-14 04:40 am | 3.3 | 2.0 | 6.7 | NW | 2.3 | 5.6 | NNW | AVERAGE | 4.5 |
| 2026-06-14 04:10 am | 3.3 | 2.0 | 7.1 | NW | 2.6 | 5.0 | NW | AVERAGE | 4.4 |
| 2026-06-14 03:40 am | 3.3 | 2.3 | 6.2 | NW | 2.3 | 5.3 | NW | STEEP | 4.5 |
| 2026-06-14 03:10 am | 3.3 | 2.3 | 6.2 | NW | 2.3 | 4.8 | NW | STEEP | 4.5 |
| 2026-06-14 02:40 am | 3.3 | 2.6 | 6.2 | NW | 2.0 | 4.8 | NW | STEEP | 4.7 |
| 2026-06-14 02:10 am | 3.3 | 2.6 | 7.1 | NW | 2.3 | 4.8 | NW | AVERAGE | 4.6 |
| 2026-06-14 01:40 am | 3.3 | 2.0 | 6.7 | NNW | 2.6 | 5.0 | NW | VERY_STEEP | 4.6 |
| 2026-06-14 01:10 am | 3.3 | 2.6 | 7.1 | NNW | 2.3 | 4.5 | NNW | AVERAGE | 4.8 |
| 2026-06-14 12:40 am | 3.6 | 2.6 | 6.7 | NW | 2.6 | 4.5 | NNW | STEEP | 4.8 |
| 2026-06-14 12:10 am | 3.6 | 2.6 | 6.7 | NNW | 2.6 | 4.3 | NNW | VERY_STEEP | 4.6 |
| 2026-06-13 11:40 pm | 3.6 | 2.3 | 6.7 | NW | 2.6 | 4.5 | NW | STEEP | 4.7 |
| 2026-06-13 11:10 pm | 3.6 | 2.3 | 6.2 | NW | 2.6 | 5.3 | NW | STEEP | 4.6 |
| 2026-06-13 10:40 pm | 3.6 | 2.6 | 6.2 | NW | 2.6 | 4.3 | NNW | STEEP | 4.5 |
| 2026-06-13 10:10 pm | 3.9 | 2.6 | 7.1 | NW | 3.0 | 4.0 | N | AVERAGE | 4.6 |
| 2026-06-13 09:40 pm | 3.9 | 2.6 | 7.1 | NW | 3.3 | 5.0 | NNW | AVERAGE | 4.6 |
| 2026-06-13 09:10 pm | 3.9 | 2.6 | 6.7 | NNW | 3.0 | 4.0 | N | STEEP | 4.5 |
| 2026-06-13 08:40 pm | 4.3 | 2.6 | 7.7 | WNW | 3.3 | 4.3 | NNW | AVERAGE | 4.6 |
| 2026-06-13 08:10 pm | 4.6 | 3.0 | 7.1 | NNW | 3.6 | 4.3 | NNW | STEEP | 4.6 |
| 2026-06-13 07:40 pm | 4.6 | 3.0 | 7.7 | NW | 3.6 | 4.0 | NNW | AVERAGE | 4.7 |
| 2026-06-13 07:10 pm | 4.6 | 2.6 | 14.8 | WNW | 3.6 | 6.2 | NNW | STEEP | 4.4 |
| 2026-06-13 06:40 pm | 4.6 | 3.0 | 7.1 | NW | 3.3 | 4.2 | NNW | STEEP | 4.7 |
| 2026-06-13 06:10 pm | 5.2 | 3.9 | 7.1 | NNW | 3.3 | 4.2 | NNW | STEEP | 5.0 |
| 2026-06-13 05:40 pm | 4.6 | 3.3 | 7.1 | NW | 3.3 | 4.2 | NW | STEEP | 4.7 |
| 2026-06-13 05:10 pm | 4.6 | 3.3 | 7.1 | NNW | 3.3 | 3.8 | NNW | STEEP | 4.8 |
| 2026-06-13 04:40 pm | 4.9 | 3.3 | 7.1 | NNW | 3.9 | 5.6 | NW | STEEP | 5.0 |
| 2026-06-13 04:10 pm | 4.6 | 3.3 | 7.1 | NW | 3.3 | 4.8 | NW | STEEP | 4.8 |
| 2026-06-13 03:40 pm | 4.6 | 3.0 | 7.1 | NNW | 3.3 | 6.2 | NNW | STEEP | 4.9 |
| 2026-06-13 03:10 pm | 4.6 | 3.3 | 7.1 | NNW | 3.0 | 5.3 | NW | STEEP | 5.1 |
| 2026-06-13 02:40 pm | 4.3 | 3.3 | 7.7 | WNW | 3.0 | 5.6 | NW | AVERAGE | 4.8 |
| 2026-06-13 02:10 pm | 4.3 | 3.0 | 6.7 | NW | 3.0 | 5.3 | WNW | STEEP | 4.9 |
| 2026-06-13 01:40 pm | 4.3 | 3.0 | 6.7 | NW | 3.0 | 5.6 | NW | STEEP | 5.0 |
| 2026-06-13 01:10 pm | 3.9 | 3.0 | 7.1 | NW | 3.0 | 6.2 | NW | AVERAGE | 4.9 |
| 2026-06-13 12:40 pm | 3.6 | 2.6 | 7.1 | NW | 2.6 | 5.6 | NW | AVERAGE | 4.9 |
| 2026-06-13 12:10 pm | 3.9 | 2.6 | 7.1 | WNW | 2.6 | 4.5 | WNW | AVERAGE | 5.0 |
| 2026-06-13 11:40 am | 3.9 | 3.0 | 7.1 | NW | 2.6 | 5.6 | NW | AVERAGE | 5.1 |
| 2026-06-13 11:10 am | 3.9 | 2.6 | 6.7 | NW | 3.0 | 5.9 | NW | STEEP | 5.0 |
| 2026-06-13 10:40 am | 3.9 | 2.6 | 6.7 | NW | 3.0 | 5.6 | WNW | STEEP | 5.0 |
| 2026-06-13 10:10 am | 3.9 | 2.6 | 7.1 | NW | 3.0 | 6.2 | NW | AVERAGE | 5.1 |
Links which are specific to this station are listed below:
Real Time Data in tabular form for the last forty-five days.
Historical Data & Climatic Summaries for quality controlled data for prior months and years.
The weekly status report and the weekly maintenance report also provide valuable station information.
Note that the payload types and the station locations occasionally change.