


Station 42023 - C13 - WFS South Buoy, 50m Isobath
Owned and maintained by COMPS (University of South Florida)
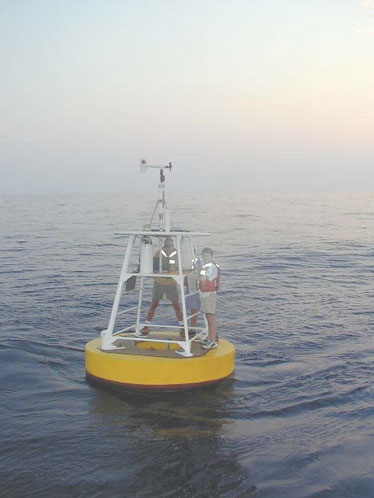
Offshore Buoy
26.010 N 83.086 W (26°0'36" N 83°5'10" W)
Site elevation: sea level
Air temp height: 2 m above site elevation
Anemometer height: 3.1 m above site elevation
Barometer elevation: 1.9 m above mean sea level
Sea temp depth: 1 m below water line
Water depth: 50 m
The highly endangered Rice's whale, a newly identified species, inhabit the northeastern Gulf of Mexico year-round along the continental shelf-break between 100m and 400m depth. Vessels can kill or injure whales - please use slow speeds and be prepared to avoid surfacing whales. To report sightings call 1-877-WHALE-HELP.
Large icon indicates selected station.
 Stations with recent data
 Stations with no data in last 8 hours
(24 hours for tsunami stations)
(24 hours for tsunami stations)
No Recent Reports
Links which are specific to this station are listed below:
Data for last 45 days:
- Real time standard meteorological data and their description.
- Real time derived measurements data and their description.
- Quality controlled data for 2024 (data descriptions)
- Historical data (data descriptions)
- Search historical meteorological data for observations that meet your threshold conditions
Some data files have been compressed with the GNU gzip program.