


![]() View the latest observations near East Pacific Hurricane Fausto.
View the latest observations near East Pacific Hurricane Fausto.
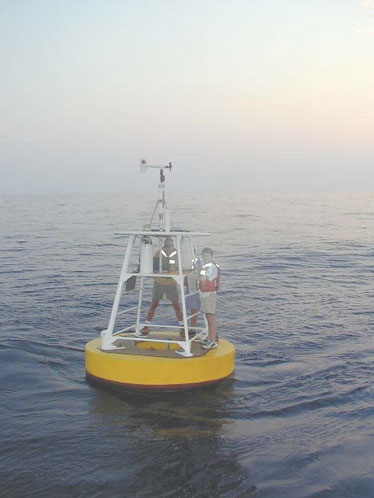
Station 42023 - C13 - WFS South Buoy, 50m Isobath 
Owned and maintained by COMPS (University of South Florida)
Offshore Buoy
26.010 N 83.086 W (26°0'36" N 83°5'10" W)
Site elevation: sea level
Air temp height: 2 m above site elevation
Anemometer height: 3.1 m above site elevation
Barometer elevation: 1.9 m above mean sea level
Sea temp depth: 1 m below water line
Water depth: 50 m
(24 hours for tsunami stations)
|
Click on the graph icon in the table below to see a time series plot of the last five days of that observation. | |
| E ( 100 deg true ) | |
| 11.7 kts | |
| 27.2 kts | |
| 30.05 in | |
| 82.6 °F | |
| 86.2 °F | |
| 36.63 psu | |
| 77.0 °F | |
| 91.2 °F | |
| 13.6 kts | |
| 15.5 kts | |
| TIME (CDT) |
WDIR |
WSPD kts |
GST kts |
WVHT ft |
DPD sec |
APD sec |
MWD |
PRES in |
PTDY in |
ATMP °F |
WTMP °F |
DEWP °F |
SAL psu |
VIS nmi |
TIDE ft |
|---|---|---|---|---|---|---|---|---|---|---|---|---|---|---|---|
| 2026-07-24 12:05 am | NNE | 7.8 | 11.7 | - | - | - | - | 30.05 | - | 85.5 | 86.4 | 79.0 | 36.62 | - | - |
| 2026-07-23 09:35 pm | NE | 5.8 | 9.7 | - | - | - | - | 30.06 | - | 85.5 | 86.5 | 77.0 | 36.66 | - | - |
| 2026-07-23 09:05 pm | NE | 5.8 | 7.8 | - | - | - | - | 30.05 | - | 85.5 | 86.5 | 76.8 | 36.60 | - | - |
| 2026-07-23 08:35 pm | NNE | 5.8 | 7.8 | - | - | - | - | 30.04 | - | 85.3 | 86.5 | 76.6 | 36.65 | - | - |
| 2026-07-23 08:05 pm | NNE | 3.9 | 5.8 | - | - | - | - | 30.03 | - | 85.3 | 86.5 | 76.1 | 36.64 | - | - |
| 2026-07-23 06:35 pm | - | - | - | - | - | - | - | - | - | - | 81.5 | - | 36.66 | - | - |
| 2026-07-23 06:05 pm | - | - | - | - | - | - | - | - | - | - | 82.2 | - | 36.65 | - | - |
| 2026-07-23 05:35 pm | N | 3.9 | 5.8 | - | - | - | - | 30.01 | - | 86.2 | 86.7 | 77.0 | 36.63 | - | - |
| 2026-07-23 05:05 pm | NNE | 3.9 | 7.8 | - | - | - | - | 30.01 | - | 85.8 | 86.7 | 77.2 | 36.63 | - | - |
| 2026-07-23 04:35 pm | NE | 5.8 | 7.8 | - | - | - | - | 30.02 | - | 85.6 | 86.7 | 77.2 | 36.63 | - | - |
| 2026-07-23 04:05 pm | NE | 5.8 | 7.8 | - | - | - | - | 30.01 | - | 85.5 | 86.7 | 77.5 | 36.66 | - | - |
| 2026-07-23 03:35 pm | ENE | 5.8 | 7.8 | - | - | - | - | 30.01 | - | 85.5 | 86.5 | 77.7 | 36.63 | - | - |
| 2026-07-23 03:05 pm | ENE | 5.8 | 7.8 | - | - | - | - | 30.01 | - | 85.5 | 86.5 | 77.2 | 36.61 | - | - |
| 2026-07-23 02:35 pm | E | 7.8 | 9.7 | - | - | - | - | 30.02 | - | 85.3 | 86.4 | 77.7 | 36.66 | - | - |
| 2026-07-23 02:05 pm | E | 7.8 | 9.7 | - | - | - | - | 30.03 | - | 85.1 | 86.4 | 76.8 | 36.61 | - | - |
| 2026-07-23 01:35 pm | E | 9.7 | 11.7 | - | - | - | - | 30.04 | - | 85.1 | 86.2 | 76.3 | 36.65 | - | - |
| 2026-07-23 01:05 pm | E | 9.7 | 11.7 | - | - | - | - | 30.05 | - | 84.7 | 86.2 | 77.4 | 36.60 | - | - |
| 2026-07-23 12:35 pm | E | 9.7 | 13.6 | - | - | - | - | 30.06 | - | 84.7 | 86.2 | 77.2 | 36.62 | - | - |
| 2026-07-23 12:05 pm | E | 9.7 | 11.7 | - | - | - | - | 30.06 | - | 84.7 | 86.0 | 77.0 | 36.66 | - | - |
| 2026-07-23 11:35 am | ESE | 9.7 | 13.6 | - | - | - | - | 30.07 | - | 84.7 | 86.0 | 77.2 | 36.61 | - | - |
| 2026-07-23 11:05 am | E | 9.7 | 13.6 | - | - | - | - | 30.07 | - | 84.9 | 85.8 | 76.8 | 36.64 | - | - |
| 2026-07-23 10:35 am | E | 11.7 | 15.5 | - | - | - | - | 30.06 | - | 84.7 | 85.8 | 77.0 | 36.60 | - | - |
| 2026-07-23 10:05 am | E | 11.7 | 13.6 | - | - | - | - | 30.06 | - | 84.7 | 85.8 | 77.4 | 36.60 | - | - |
| 2026-07-23 08:35 am | ESE | 11.7 | 13.6 | - | - | - | - | 30.06 | - | 84.6 | 85.8 | 77.0 | 36.62 | - | - |
| 2026-07-23 08:05 am | ESE | 11.7 | 13.6 | - | - | - | - | 30.05 | - | 84.7 | 85.8 | 76.8 | 36.62 | - | - |
| 2026-07-23 07:35 am | E | 11.7 | 13.6 | - | - | - | - | 30.05 | - | 84.7 | 85.8 | 75.7 | 36.62 | - | - |
| 2026-07-23 07:05 am | ESE | 11.7 | 15.5 | - | - | - | - | 30.04 | - | 84.6 | 85.8 | 77.0 | 36.61 | - | - |
| 2026-07-23 06:35 am | ESE | 11.7 | 13.6 | - | - | - | - | 30.03 | - | 84.6 | 85.8 | 77.5 | 36.60 | - | - |
| 2026-07-23 06:05 am | ESE | 7.8 | 9.7 | - | - | - | - | 30.03 | - | 83.8 | 85.8 | 77.0 | 36.60 | - | - |
| 2026-07-23 05:35 am | E | 9.7 | 11.7 | - | - | - | - | 30.02 | - | 83.8 | 85.8 | 78.1 | 36.59 | - | - |
| 2026-07-23 05:05 am | E | 9.7 | 13.6 | - | - | - | - | 30.01 | - | 83.7 | 86.0 | 77.7 | 36.63 | - | - |
| 2026-07-23 04:35 am | E | 9.7 | 11.7 | - | - | - | - | 30.00 | - | 83.7 | 86.0 | 76.8 | 36.62 | - | - |
| 2026-07-23 04:05 am | E | 9.7 | 11.7 | - | - | - | - | 30.00 | - | 83.7 | 86.0 | 77.2 | 36.61 | - | - |
| 2026-07-23 03:35 am | E | 7.8 | 11.7 | - | - | - | - | 30.00 | - | 83.7 | 86.0 | 77.5 | 36.60 | - | - |
| 2026-07-23 03:05 am | E | 7.8 | 11.7 | - | - | - | - | 30.00 | - | 83.1 | 86.0 | 77.9 | 36.59 | - | - |
Disclaimer: Ocean current directions are reported to the nearest 10 degrees and speeds are measured to the nearest whole centimeter per second.
Ocean Current Data for 42023
| 11:56 pm CDT | 10:56 pm CDT | |||
|---|---|---|---|---|
| Depth ft | Dir ° | Speed kts |
Dir ° | Speed kts |
| 10 | 110 | 0.12 | 120 | 0.14 |
| 13 | 130 | 0.12 | 110 | 0.19 |
| 16 | 150 | 0.12 | 110 | 0.19 |
| 20 | 140 | 0.16 | 110 | 0.17 |
| 23 | 170 | 0.08 | 110 | 0.16 |
| 26 | 120 | 0.08 | 100 | 0.17 |
| 30 | 140 | 0.08 | 80 | 0.08 |
| 33 | 170 | 0.08 | 70 | 0.04 |
| 36 | 130 | 0.06 | 80 | 0.06 |
| 39 | 120 | 0.02 | 70 | 0.08 |
| 43 | 120 | 0.06 | 70 | 0.08 |
| 46 | 120 | 0.04 | 60 | 0.08 |
| 49 | 0 | 0.06 | 10 | 0.06 |
| 52 | 30 | 0.12 | 20 | 0.10 |
| 56 | 360 | 0.08 | 30 | 0.10 |
| 59 | 330 | 0.10 | 40 | 0.08 |
| 62 | 330 | 0.08 | 360 | 0.10 |
| 66 | 340 | 0.10 | 10 | 0.12 |
| 69 | 340 | 0.14 | 10 | 0.12 |
| 72 | 340 | 0.14 | 350 | 0.12 |
| 75 | 340 | 0.12 | 340 | 0.14 |
| 79 | 330 | 0.14 | 330 | 0.14 |
| 82 | 330 | 0.16 | 340 | 0.16 |
| 85 | 330 | 0.19 | 330 | 0.14 |
| 89 | 350 | 0.21 | 330 | 0.16 |
| 92 | 350 | 0.23 | 340 | 0.19 |
| 95 | 360 | 0.27 | 350 | 0.29 |
| 98 | 340 | 0.33 | 350 | 0.31 |
| 102 | 330 | 0.35 | 340 | 0.37 |
| 105 | 330 | 0.31 | 330 | 0.33 |
| 108 | 330 | 0.31 | 320 | 0.31 |
| 112 | 330 | 0.31 | 320 | 0.25 |
| 115 | 330 | 0.29 | 320 | 0.27 |
| 118 | 320 | 0.25 | 320 | 0.23 |
| 121 | 320 | 0.21 | 310 | 0.21 |
| 125 | 320 | 0.16 | 310 | 0.16 |
| 128 | 300 | 0.12 | 300 | 0.14 |
| 131 | 290 | 0.10 | 260 | 0.10 |
| 135 | 260 | 0.12 | 240 | 0.10 |
| 138 | 230 | 0.10 | 230 | 0.08 |
Previous (up to 48) reports of ocean current data for 42023
Ocean Current Stick Plots are available in metric units only:
All Instruments -  1-day plot 3-day plot 5-day plot
|
These oceanographic data are displayed in rounded times. Click on the graph icon in the table below to see a time series plot of the last five days of that observation. | |
| Depth (DEPTH): | 3.3 ft |
| 86.25 °F | |
| 36.63 psu | |
| TIME (CDT) |
DEPTH ft |
OTMP °F |
COND mS/cm |
SAL psu |
O2% % |
O2PPM ppm |
CLCON ug/l |
TURB FTU |
PH |
EH mV |
|---|---|---|---|---|---|---|---|---|---|---|
| 2026-07-24 12:35 am | 0.0 | 86.25 | - | 36.63 | - | - | - | - | - | - |
| 2026-07-24 12:05 am | 3.3 | 86.27 | - | 36.62 | - | - | - | - | - | - |
| 2026-07-24 12:05 am | 0.0 | 86.27 | - | 36.62 | - | - | - | - | - | - |
| 2026-07-23 09:35 pm | 3.3 | 86.49 | - | 36.66 | - | - | - | - | - | - |
| 2026-07-23 09:35 pm | 0.0 | 86.49 | - | 36.66 | - | - | - | - | - | - |
| 2026-07-23 09:05 pm | 3.3 | 86.47 | - | 36.60 | - | - | - | - | - | - |
| 2026-07-23 09:05 pm | 0.0 | 86.47 | - | 36.60 | - | - | - | - | - | - |
| 2026-07-23 08:35 pm | 3.3 | 86.52 | - | 36.65 | - | - | - | - | - | - |
| 2026-07-23 08:35 pm | 0.0 | 86.52 | - | 36.65 | - | - | - | - | - | - |
| 2026-07-23 08:05 pm | 3.3 | 86.54 | - | 36.64 | - | - | - | - | - | - |
| 2026-07-23 08:05 pm | 0.0 | 86.54 | - | 36.64 | - | - | - | - | - | - |
| 2026-07-23 06:35 pm | 3.3 | 86.81 | - | 36.66 | - | - | - | - | - | - |
| 2026-07-23 06:35 pm | 0.0 | 86.81 | - | 36.66 | - | - | - | - | - | - |
| 2026-07-23 06:05 pm | 3.3 | 86.85 | - | 36.65 | - | - | - | - | - | - |
| 2026-07-23 06:05 pm | 0.0 | 86.85 | - | 36.65 | - | - | - | - | - | - |
| 2026-07-23 05:35 pm | 3.3 | 86.74 | - | 36.63 | - | - | - | - | - | - |
| 2026-07-23 05:35 pm | 0.0 | 86.74 | - | 36.63 | - | - | - | - | - | - |
| 2026-07-23 05:05 pm | 3.3 | 86.72 | - | 36.63 | - | - | - | - | - | - |
| 2026-07-23 05:05 pm | 0.0 | 86.72 | - | 36.63 | - | - | - | - | - | - |
| 2026-07-23 04:35 pm | 3.3 | 86.74 | - | 36.63 | - | - | - | - | - | - |
| 2026-07-23 04:35 pm | 0.0 | 86.74 | - | 36.63 | - | - | - | - | - | - |
| 2026-07-23 04:05 pm | 3.3 | 86.65 | - | 36.66 | - | - | - | - | - | - |
| 2026-07-23 04:05 pm | 0.0 | 86.65 | - | 36.66 | - | - | - | - | - | - |
| 2026-07-23 03:35 pm | 3.3 | 86.58 | - | 36.63 | - | - | - | - | - | - |
| 2026-07-23 03:35 pm | 0.0 | 86.58 | - | 36.63 | - | - | - | - | - | - |
| 2026-07-23 03:05 pm | 3.3 | 86.45 | - | 36.61 | - | - | - | - | - | - |
| 2026-07-23 03:05 pm | 0.0 | 86.45 | - | 36.61 | - | - | - | - | - | - |
| 2026-07-23 02:35 pm | 3.3 | 86.32 | - | 36.66 | - | - | - | - | - | - |
| 2026-07-23 02:35 pm | 0.0 | 86.32 | - | 36.66 | - | - | - | - | - | - |
| 2026-07-23 02:05 pm | 3.3 | 86.29 | - | 36.61 | - | - | - | - | - | - |
| 2026-07-23 02:05 pm | 0.0 | 86.29 | - | 36.61 | - | - | - | - | - | - |
| 2026-07-23 01:35 pm | 3.3 | 86.20 | - | 36.65 | - | - | - | - | - | - |
| 2026-07-23 01:35 pm | 0.0 | 86.20 | - | 36.65 | - | - | - | - | - | - |
| 2026-07-23 01:05 pm | 3.3 | 86.14 | - | 36.60 | - | - | - | - | - | - |
| 2026-07-23 01:05 pm | 0.0 | 86.14 | - | 36.60 | - | - | - | - | - | - |
| 2026-07-23 12:35 pm | 3.3 | 86.11 | - | 36.62 | - | - | - | - | - | - |
| 2026-07-23 12:35 pm | 0.0 | 86.11 | - | 36.62 | - | - | - | - | - | - |
| 2026-07-23 12:05 pm | 3.3 | 86.02 | - | 36.66 | - | - | - | - | - | - |
| 2026-07-23 12:05 pm | 0.0 | 86.02 | - | 36.66 | - | - | - | - | - | - |
| 2026-07-23 11:35 am | 3.3 | 85.96 | - | 36.61 | - | - | - | - | - | - |
| 2026-07-23 11:35 am | 0.0 | 85.96 | - | 36.61 | - | - | - | - | - | - |
| 2026-07-23 11:05 am | 3.3 | 85.89 | - | 36.64 | - | - | - | - | - | - |
| 2026-07-23 11:05 am | 0.0 | 85.89 | - | 36.64 | - | - | - | - | - | - |
| 2026-07-23 10:35 am | 3.3 | 85.84 | - | 36.60 | - | - | - | - | - | - |
| 2026-07-23 10:35 am | 0.0 | 85.84 | - | 36.60 | - | - | - | - | - | - |
| 2026-07-23 10:05 am | 3.3 | 85.82 | - | 36.60 | - | - | - | - | - | - |
| 2026-07-23 10:05 am | 0.0 | 85.82 | - | 36.60 | - | - | - | - | - | - |
| 2026-07-23 08:35 am | 3.3 | 85.78 | - | 36.62 | - | - | - | - | - | - |
| 2026-07-23 08:35 am | 0.0 | 85.78 | - | 36.62 | - | - | - | - | - | - |
| 2026-07-23 08:05 am | 3.3 | 85.78 | - | 36.62 | - | - | - | - | - | - |
| 2026-07-23 08:05 am | 0.0 | 85.78 | - | 36.62 | - | - | - | - | - | - |
| 2026-07-23 07:35 am | 3.3 | 85.78 | - | 36.62 | - | - | - | - | - | - |
| 2026-07-23 07:35 am | 0.0 | 85.78 | - | 36.62 | - | - | - | - | - | - |
| 2026-07-23 07:05 am | 3.3 | 85.80 | - | 36.61 | - | - | - | - | - | - |
| 2026-07-23 07:05 am | 0.0 | 85.80 | - | 36.61 | - | - | - | - | - | - |
| 2026-07-23 06:35 am | 3.3 | 85.82 | - | 36.60 | - | - | - | - | - | - |
| 2026-07-23 06:35 am | 0.0 | 85.82 | - | 36.60 | - | - | - | - | - | - |
| 2026-07-23 06:05 am | 3.3 | 85.84 | - | 36.60 | - | - | - | - | - | - |
| 2026-07-23 06:05 am | 0.0 | 85.84 | - | 36.60 | - | - | - | - | - | - |
| 2026-07-23 05:35 am | 3.3 | 85.86 | - | 36.59 | - | - | - | - | - | - |
| 2026-07-23 05:35 am | 0.0 | 85.86 | - | 36.59 | - | - | - | - | - | - |
| 2026-07-23 05:05 am | 3.3 | 85.91 | - | 36.63 | - | - | - | - | - | - |
| 2026-07-23 05:05 am | 0.0 | 85.91 | - | 36.63 | - | - | - | - | - | - |
| 2026-07-23 04:35 am | 3.3 | 85.95 | - | 36.62 | - | - | - | - | - | - |
| 2026-07-23 04:35 am | 0.0 | 85.95 | - | 36.62 | - | - | - | - | - | - |
| 2026-07-23 04:05 am | 3.3 | 85.96 | - | 36.61 | - | - | - | - | - | - |
| 2026-07-23 04:05 am | 0.0 | 85.96 | - | 36.61 | - | - | - | - | - | - |
| 2026-07-23 03:35 am | 3.3 | 85.98 | - | 36.60 | - | - | - | - | - | - |
| 2026-07-23 03:35 am | 0.0 | 85.98 | - | 36.60 | - | - | - | - | - | - |
| 2026-07-23 03:05 am | 3.3 | 86.02 | - | 36.59 | - | - | - | - | - | - |
| 2026-07-23 03:05 am | 0.0 | 86.02 | - | 36.59 | - | - | - | - | - | - |
Links which are specific to this station are listed below:
Real Time Data in tabular form for the last forty-five days.
Historical Data & Climatic Summaries for quality controlled data for prior months and years.