


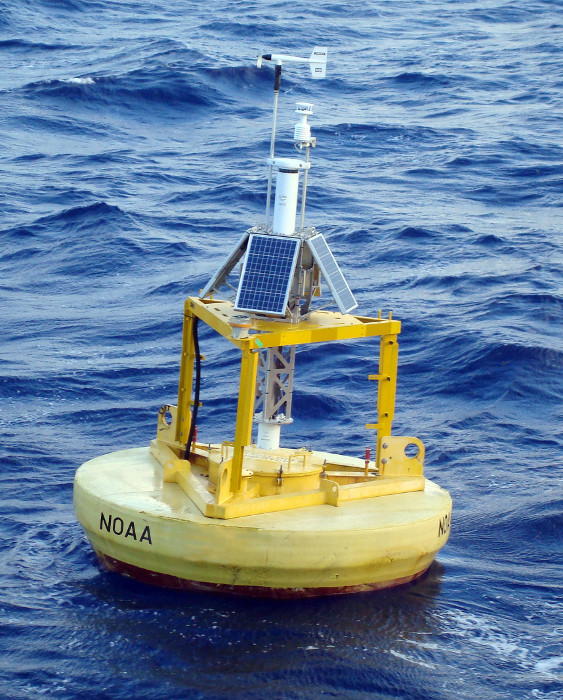
Station 41049 - SOUTH BERMUDA - 300 NM SSE of Bermuda 
Owned and maintained by National Data Buoy Center
3-meter foam buoy
SCOOP payload
27.505 N 62.271 W (27°30'17" N 62°16'14" W)
Site elevation: sea level
Air temp height: 3.7 m above site elevation
Anemometer height: 4.1 m above site elevation
Barometer elevation: 2.7 m above mean sea level
Sea temp depth: 1.5 m below water line
Water depth: 5480 m
Watch circle radius: 5615 yards
(24 hours for tsunami stations)

|
Click on the graph icon in the table below to see a time series plot of the last five days of that observation. | |
| NNW ( 340 deg true ) | |
| 1.9 kts | |
| 3.9 kts | |
| 3.6 ft | |
| 13 sec | |
| 6.1 sec | |
| NE ( 45 deg true ) | |
| 30.08 in | |
| 76.3 °F | |
| 77.4 °F | |
| 64.4 °F | |
| 1.9 kts | |
| 1.9 kts | |
|
||||||||||||||||||
| TIME (GMT) |
WDIR |
WSPD kts |
GST kts |
WVHT ft |
DPD sec |
APD sec |
MWD |
PRES in |
PTDY in |
ATMP °F |
WTMP °F |
DEWP °F |
SAL psu |
VIS nmi |
TIDE ft |
|---|---|---|---|---|---|---|---|---|---|---|---|---|---|---|---|
| 2026-01-08 1840 | - | 0.0 | 1.9 | - | - | - | - | 30.08 | - | 76.5 | 77.4 | 64.8 | - | - | - |
| 2026-01-08 1830 | - | 0.0 | 1.9 | - | - | - | - | 30.08 | - | 75.7 | 77.4 | 64.6 | - | - | - |
| 2026-01-08 1820 | - | 0.0 | 1.9 | 3.6 | 11 | 6.1 | NE | 30.08 | - | 75.4 | 77.4 | 64.2 | - | - | - |
| 2026-01-08 1810 | - | 0.0 | 1.9 | 3.6 | - | 6.1 | NE | 30.08 | - | 75.6 | 77.4 | 64.2 | - | - | - |
| 2026-01-08 1800 | - | 0.0 | 1.9 | - | - | - | - | 30.08 | -0.03 | 76.5 | 77.4 | 64.6 | - | - | - |
| 2026-01-08 1750 | SE | 1.9 | 1.9 | 3.6 | 12 | 6.4 | NE | 30.08 | - | 76.3 | 77.4 | 64.6 | - | - | - |
| 2026-01-08 1740 | - | 0.0 | 1.9 | 3.6 | - | 6.4 | NE | 30.08 | - | 76.3 | 77.4 | 64.8 | - | - | - |
| 2026-01-08 1730 | SE | 1.9 | 3.9 | - | - | - | - | 30.09 | - | 76.1 | 77.2 | 64.6 | - | - | - |
| 2026-01-08 1720 | - | 0.0 | 1.9 | 3.9 | 12 | 6.3 | NE | 30.09 | - | 76.6 | 77.2 | 64.8 | - | - | - |
| 2026-01-08 1710 | - | 0.0 | 1.9 | 3.9 | - | 6.3 | NE | 30.09 | - | 76.3 | 77.2 | 64.4 | - | - | - |
| 2026-01-08 1700 | - | 0.0 | 1.9 | - | - | - | - | 30.09 | -0.02 | 76.3 | 77.4 | 64.4 | - | - | - |
| 2026-01-08 1650 | - | 0.0 | 1.9 | 3.6 | 12 | 6.1 | NE | 30.09 | - | 76.5 | 77.2 | 64.8 | - | - | - |
| 2026-01-08 1640 | - | 0.0 | 1.9 | - | - | - | - | 30.09 | - | 75.7 | 77.2 | 64.2 | - | - | - |
| 2026-01-08 1630 | SE | 1.9 | 1.9 | - | - | - | - | 30.10 | - | 75.4 | 77.2 | 64.4 | - | - | - |
| 2026-01-08 1620 | SE | 1.9 | 3.9 | 3.9 | 11 | 6.2 | NE | 30.10 | - | 75.2 | 77.2 | 64.2 | - | - | - |
| 2026-01-08 1610 | SE | 1.9 | 5.8 | 3.9 | - | 6.2 | NE | 30.10 | - | 75.2 | 77.2 | 64.8 | - | - | - |
| 2026-01-08 1600 | SSE | 3.9 | 5.8 | - | - | - | - | 30.11 | -0.01 | 75.0 | 77.0 | 64.8 | - | - | - |
| 2026-01-08 1550 | SE | 3.9 | 5.8 | 3.9 | 11 | 6.3 | NE | 30.11 | - | 75.2 | 77.0 | 64.9 | - | - | - |
| 2026-01-08 1540 | SSE | 3.9 | 3.9 | - | - | - | - | 30.11 | - | 75.0 | 77.0 | 64.6 | - | - | - |
| 2026-01-08 1530 | SE | 3.9 | 5.8 | - | - | - | - | 30.11 | - | 75.0 | 77.0 | 64.8 | - | - | - |
| 2026-01-08 1520 | SE | 3.9 | 5.8 | 4.3 | 12 | 6.4 | NE | 30.12 | - | 75.0 | 77.0 | 64.6 | - | - | - |
| 2026-01-08 1510 | SE | 3.9 | 5.8 | 4.3 | - | 6.4 | NE | 30.12 | - | 75.0 | 77.0 | 64.4 | - | - | - |
| 2026-01-08 1500 | SE | 5.8 | 7.8 | - | - | - | - | 30.12 | +0.02 | 75.0 | 77.0 | 64.4 | - | - | - |
| 2026-01-08 1450 | SE | 5.8 | 5.8 | 3.9 | 8 | 6.1 | NE | 30.12 | - | 75.0 | 77.0 | 63.9 | - | - | - |
| 2026-01-08 1440 | SE | 5.8 | 7.8 | - | - | - | - | 30.12 | - | 75.0 | 76.8 | 63.7 | - | - | - |
| 2026-01-08 1430 | SE | 3.9 | 5.8 | - | - | - | - | 30.12 | - | 74.8 | 76.8 | 63.3 | - | - | - |
| 2026-01-08 1420 | ESE | 5.8 | 7.8 | 4.3 | 7 | 6.1 | ENE | 30.12 | - | 74.8 | 76.8 | 63.7 | - | - | - |
| 2026-01-08 1410 | ESE | 5.8 | 7.8 | 4.3 | - | 6.1 | ENE | 30.12 | - | 75.0 | 76.8 | 64.2 | - | - | - |
| 2026-01-08 1400 | ESE | 5.8 | 7.8 | - | - | - | - | 30.12 | +0.04 | 74.8 | 76.8 | 63.7 | - | - | - |
| 2026-01-08 1350 | ESE | 5.8 | 7.8 | 3.9 | 11 | 6.1 | NE | 30.12 | - | 75.0 | 76.8 | 63.7 | - | - | - |
| 2026-01-08 1340 | ESE | 5.8 | 7.8 | - | - | - | - | 30.12 | - | 74.8 | 76.8 | 63.5 | - | - | - |
| 2026-01-08 1330 | ESE | 5.8 | 7.8 | - | - | - | - | 30.11 | - | 74.8 | 76.8 | 64.0 | - | - | - |
| 2026-01-08 1320 | ESE | 5.8 | 7.8 | 3.9 | 12 | 6.1 | NE | 30.11 | - | 74.8 | 76.6 | 63.9 | - | - | - |
| 2026-01-08 1310 | ESE | 5.8 | 7.8 | 3.9 | - | 6.1 | NE | 30.11 | - | 75.0 | 76.6 | 63.7 | - | - | - |
| 2026-01-08 1300 | ESE | 5.8 | 7.8 | - | - | - | - | 30.11 | +0.04 | 74.8 | 76.6 | 63.5 | - | - | - |
| 2026-01-08 1250 | ESE | 5.8 | 7.8 | 4.3 | 11 | 6.1 | NE | 30.11 | - | 74.8 | 76.6 | 63.3 | - | - | - |
| 2026-01-08 1240 | ESE | 5.8 | 5.8 | - | - | - | - | 30.11 | - | 74.8 | 76.6 | 64.2 | - | - | - |
| 2026-01-08 1230 | ESE | 5.8 | 5.8 | - | - | - | - | 30.10 | - | 74.8 | 76.6 | 63.9 | - | - | - |
| 2026-01-08 1220 | ESE | 3.9 | 5.8 | 4.3 | 11 | 6.0 | NE | 30.10 | - | 74.7 | 76.6 | 63.9 | - | - | - |
| 2026-01-08 1210 | ESE | 3.9 | 5.8 | 4.3 | - | 6.0 | NE | 30.10 | - | 74.8 | 76.6 | 64.0 | - | - | - |
| 2026-01-08 1200 | ESE | 3.9 | 5.8 | - | - | - | - | 30.10 | +0.04 | 74.7 | - | 63.7 | - | - | - |
| 2026-01-08 1150 | ESE | 5.8 | 5.8 | 4.6 | 12 | 6.2 | NE | 30.10 | - | 74.5 | 76.5 | 63.5 | - | - | - |
| 2026-01-08 1140 | ESE | 3.9 | 5.8 | - | - | - | - | 30.10 | - | 74.5 | 76.5 | 63.3 | - | - | - |
| 2026-01-08 1130 | ESE | 5.8 | 7.8 | - | - | - | - | 30.09 | - | 74.3 | 76.5 | 62.8 | - | - | - |
| 2026-01-08 1120 | ESE | 5.8 | 7.8 | 4.6 | 9 | 6.2 | NNE | 30.09 | - | 74.5 | 76.5 | 63.1 | - | - | - |
| 2026-01-08 1110 | ESE | 5.8 | 7.8 | 4.6 | - | 6.2 | NNE | 30.08 | - | 74.3 | 76.5 | 62.8 | - | - | - |
| 2026-01-08 1100 | ESE | 5.8 | 7.8 | - | - | - | - | 30.08 | +0.02 | 74.3 | 76.5 | 63.0 | - | - | - |
| 2026-01-08 1050 | ESE | 5.8 | 7.8 | 4.3 | 6 | 5.9 | ESE | 30.08 | - | 74.3 | 76.5 | 62.2 | - | - | - |
| 2026-01-08 1040 | ESE | 5.8 | 7.8 | - | - | - | - | 30.08 | - | 74.3 | 76.5 | 62.6 | - | - | - |
| 2026-01-08 1030 | ESE | 5.8 | 7.8 | - | - | - | - | 30.08 | - | 74.3 | 76.5 | 63.0 | - | - | - |
| 2026-01-08 1020 | ESE | 5.8 | 7.8 | 4.6 | 9 | 6.3 | NNE | 30.08 | - | 74.1 | 76.5 | 63.0 | - | - | - |
| 2026-01-08 1010 | ESE | 5.8 | 7.8 | 4.6 | - | 6.3 | NNE | 30.07 | - | 74.1 | 76.5 | 63.0 | - | - | - |
| 2026-01-08 1000 | ESE | 5.8 | 7.8 | - | - | - | - | 30.07 | +0.01 | 74.1 | 76.5 | 63.5 | - | - | - |
| 2026-01-08 0950 | SE | 5.8 | 7.8 | 4.3 | 6 | 6.0 | ESE | 30.07 | - | 74.1 | 76.5 | 63.3 | - | - | - |
| 2026-01-08 0940 | SE | 5.8 | 7.8 | - | - | - | - | 30.07 | - | 74.1 | 76.5 | 63.5 | - | - | - |
| 2026-01-08 0930 | SE | 5.8 | 7.8 | - | - | - | - | 30.06 | - | 74.3 | 76.5 | 63.9 | - | - | - |
| 2026-01-08 0920 | ESE | 5.8 | 7.8 | 4.9 | 6 | 6.0 | E | 30.06 | - | 74.1 | 76.5 | 63.3 | - | - | - |
| 2026-01-08 0910 | SE | 7.8 | 7.8 | 4.9 | - | 6.0 | E | 30.06 | - | 74.1 | 76.5 | 63.7 | - | - | - |
| 2026-01-08 0900 | ESE | 7.8 | 9.7 | - | - | - | - | 30.06 | +0.00 | 74.3 | 76.5 | 64.2 | - | - | - |
| 2026-01-08 0850 | ESE | 5.8 | 9.7 | 4.6 | 6 | 6.0 | E | 30.06 | - | 74.1 | 76.5 | 63.7 | - | - | - |
| 2026-01-08 0840 | ESE | 7.8 | 9.7 | - | - | - | - | 30.06 | - | 74.1 | 76.5 | 64.0 | - | - | - |
| 2026-01-08 0830 | ESE | 7.8 | 9.7 | - | - | - | - | 30.06 | - | 74.1 | 76.5 | 64.2 | - | - | - |
| 2026-01-08 0820 | ESE | 7.8 | 9.7 | 4.9 | 9 | 6.1 | NNE | 30.06 | - | 74.1 | 76.5 | 64.4 | - | - | - |
| 2026-01-08 0810 | ESE | 9.7 | 11.7 | 4.9 | - | 6.1 | NNE | 30.06 | - | 74.1 | 76.5 | 64.6 | - | - | - |
| 2026-01-08 0800 | ESE | 7.8 | 9.7 | - | - | - | - | 30.06 | -0.02 | 74.1 | 76.3 | 64.4 | - | - | - |
| 2026-01-08 0750 | ESE | 7.8 | 11.7 | 4.6 | 12 | 6.0 | ENE | 30.06 | - | 74.1 | 76.5 | 64.4 | - | - | - |
| 2026-01-08 0740 | SE | 7.8 | 11.7 | 4.6 | - | 6.0 | ENE | 30.06 | - | 74.1 | 76.5 | 64.2 | - | - | - |
| 2026-01-08 0730 | ESE | 7.8 | 9.7 | - | - | - | - | 30.06 | - | 74.1 | 76.5 | 64.9 | - | - | - |
| 2026-01-08 0720 | ESE | 7.8 | 11.7 | 4.3 | 9 | 5.9 | NNE | 30.06 | - | 74.3 | 76.5 | 65.1 | - | - | - |
| 2026-01-08 0710 | SE | 7.8 | 9.7 | 4.3 | - | 5.9 | NNE | 30.06 | - | 74.3 | 76.3 | 65.1 | - | - | - |
| 2026-01-08 0700 | SE | 9.7 | 9.7 | - | - | - | - | 30.06 | -0.02 | 74.3 | 76.3 | 64.9 | - | - | - |
| 2026-01-08 0650 | SE | 9.7 | 11.7 | 4.6 | 10 | 6.1 | NNE | 30.06 | - | 74.1 | 76.3 | 64.6 | - | - | - |
| 2026-01-08 0640 | SE | 9.7 | 13.6 | - | - | - | - | 30.06 | - | 74.3 | 76.3 | 65.5 | - | - | - |
| 2026-01-08 0630 | SE | 9.7 | 13.6 | - | - | - | - | 30.06 | - | 74.1 | 76.3 | 65.8 | - | - | - |
| 2026-01-08 0620 | ESE | 9.7 | 11.7 | 4.3 | 10 | 5.8 | NNE | 30.06 | - | 74.1 | 76.3 | 65.7 | - | - | - |
| 2026-01-08 0610 | ESE | 9.7 | 13.6 | 4.3 | - | 5.8 | NNE | 30.06 | - | 74.1 | - | 65.7 | - | - | - |
| 2026-01-08 0600 | ESE | 9.7 | 13.6 | - | - | - | - | 30.06 | -0.03 | 74.3 | 76.3 | 65.7 | - | - | - |
| 2026-01-08 0550 | SE | 9.7 | 11.7 | 4.9 | 10 | 6.1 | NE | 30.07 | - | 74.3 | 76.3 | 65.3 | - | - | - |
| 2026-01-08 0540 | ESE | 9.7 | 11.7 | - | - | - | - | 30.07 | - | 74.3 | 76.3 | 65.8 | - | - | - |
| 2026-01-08 0530 | ESE | 9.7 | 11.7 | - | - | - | - | 30.07 | - | 74.3 | 76.3 | 65.5 | - | - | - |
| 2026-01-08 0520 | ESE | 9.7 | 11.7 | 4.6 | 7 | 5.8 | NE | 30.08 | - | 74.3 | 76.3 | 65.5 | - | - | - |
| 2026-01-08 0510 | ESE | 9.7 | 11.7 | 4.6 | - | 5.8 | NE | 30.08 | - | 74.3 | 76.3 | 65.5 | - | - | - |
| 2026-01-08 0500 | ESE | 9.7 | 13.6 | - | - | - | - | 30.08 | -0.02 | 74.5 | 76.3 | 66.4 | - | - | - |
| 2026-01-08 0450 | ESE | 11.7 | 13.6 | 4.6 | 9 | 5.8 | N | 30.08 | - | 74.3 | 76.3 | 65.8 | - | - | - |
| 2026-01-08 0440 | ESE | 9.7 | 13.6 | - | - | - | - | 30.08 | - | 74.5 | 76.3 | 65.7 | - | - | - |
| 2026-01-08 0430 | ESE | 11.7 | 13.6 | - | - | - | - | 30.08 | - | 74.5 | 76.3 | 65.7 | - | - | - |
| 2026-01-08 0420 | ESE | 11.7 | 15.5 | 5.2 | 10 | 5.9 | NNE | 30.08 | - | 74.5 | 76.3 | 66.4 | - | - | - |
| 2026-01-08 0410 | ESE | 11.7 | 15.5 | 5.2 | - | 5.9 | NNE | 30.08 | - | 74.5 | 76.3 | 66.2 | - | - | - |
| 2026-01-08 0400 | ESE | 11.7 | 13.6 | - | - | - | - | 30.08 | -0.01 | 74.5 | 76.3 | 65.7 | - | - | - |
| 2026-01-08 0350 | ESE | 11.7 | 15.5 | 4.9 | 10 | 5.9 | NNE | 30.09 | - | 74.7 | 76.3 | 65.8 | - | - | - |
| 2026-01-08 0340 | ESE | 11.7 | 13.6 | 4.9 | - | 5.9 | NNE | 30.09 | - | 74.7 | 76.3 | 65.5 | - | - | - |
| 2026-01-08 0330 | ESE | 11.7 | 13.6 | - | - | - | - | 30.09 | - | 74.7 | 76.3 | 65.7 | - | - | - |
| 2026-01-08 0320 | ESE | 11.7 | 13.6 | 4.9 | 10 | 6.0 | NE | 30.10 | - | 74.7 | 76.3 | 66.2 | - | - | - |
| 2026-01-08 0310 | ESE | 11.7 | 13.6 | 4.9 | - | 6.0 | NE | 30.10 | - | 74.8 | 76.3 | 65.8 | - | - | - |
| 2026-01-08 0300 | ESE | 11.7 | 13.6 | - | - | - | - | 30.09 | +0.00 | 74.8 | 76.5 | 66.0 | - | - | - |
| 2026-01-08 0250 | ESE | 11.7 | 13.6 | 4.9 | 10 | 5.8 | NE | 30.10 | - | 74.8 | 76.5 | 65.8 | - | - | - |
| 2026-01-08 0240 | ESE | 11.7 | 13.6 | - | - | - | - | 30.10 | - | 74.8 | 76.5 | 65.7 | - | - | - |
| 2026-01-08 0230 | ESE | 11.7 | 13.6 | - | - | - | - | 30.10 | - | 74.8 | 76.5 | 65.7 | - | - | - |
| 2026-01-08 0220 | ESE | 11.7 | 15.5 | 4.9 | 10 | 5.9 | NNE | 30.10 | - | 75.0 | 76.5 | 65.5 | - | - | - |
| 2026-01-08 0210 | ESE | 11.7 | 13.6 | 4.9 | - | 5.9 | NNE | 30.10 | - | 75.0 | 76.5 | 65.3 | - | - | - |
| 2026-01-08 0200 | ESE | 11.7 | 13.6 | - | - | - | - | 30.10 | +0.01 | 75.0 | 76.5 | 65.5 | - | - | - |
| 2026-01-08 0150 | ESE | 11.7 | 13.6 | 5.2 | 12 | 5.9 | NE | 30.10 | - | 75.0 | 76.5 | 65.7 | - | - | - |
| 2026-01-08 0140 | ESE | 11.7 | 13.6 | - | - | - | - | 30.10 | - | 75.0 | 76.5 | 65.7 | - | - | - |
| 2026-01-08 0130 | ESE | 11.7 | 13.6 | - | - | - | - | 30.10 | - | 75.0 | 76.5 | 65.8 | - | - | - |
| 2026-01-08 0120 | ESE | 11.7 | 13.6 | 5.2 | 11 | 5.9 | N | 30.10 | - | 75.0 | 76.5 | 65.3 | - | - | - |
| 2026-01-08 0110 | ESE | 11.7 | 13.6 | 5.2 | - | 5.9 | N | 30.10 | - | 75.2 | 76.5 | 66.0 | - | - | - |
| 2026-01-08 0100 | ESE | 11.7 | 15.5 | - | - | - | - | 30.10 | +0.01 | 75.0 | 76.5 | 65.7 | - | - | - |
| 2026-01-08 0050 | ESE | 11.7 | 13.6 | 4.9 | 10 | 5.9 | NNE | 30.10 | - | 75.0 | 76.5 | 65.1 | - | - | - |
| 2026-01-08 0040 | ESE | 11.7 | 15.5 | - | - | - | - | 30.10 | - | 75.0 | 76.5 | 65.7 | - | - | - |
| 2026-01-08 0030 | ESE | 11.7 | 15.5 | - | - | - | - | 30.10 | - | 75.0 | 76.5 | 66.6 | - | - | - |
| 2026-01-08 0020 | ESE | 11.7 | 13.6 | 5.2 | 11 | 6.0 | NNE | 30.10 | - | 74.8 | 76.5 | 66.6 | - | - | - |
| 2026-01-08 0010 | ESE | 13.6 | 17.5 | 5.2 | - | 6.0 | NNE | 30.09 | - | 74.8 | 76.5 | 66.7 | - | - | - |
| 2026-01-08 0000 | ESE | 13.6 | 15.5 | - | - | - | - | 30.09 | +0.01 | 75.0 | 76.5 | 67.1 | - | - | - |
| 2026-01-07 2350 | E | 11.7 | 15.5 | 5.9 | 10 | 6.1 | N | 30.09 | - | 75.0 | 76.6 | 66.7 | - | - | - |
| 2026-01-07 2340 | E | 11.7 | 15.5 | - | - | - | - | 30.09 | - | 75.0 | 76.6 | 66.6 | - | - | - |
| 2026-01-07 2320 | ESE | 11.7 | 13.6 | 5.6 | 11 | 6.3 | NNE | 30.09 | - | 75.2 | 76.6 | 66.0 | - | - | - |
| 2026-01-07 2310 | ESE | 11.7 | 13.6 | 5.6 | - | 6.3 | NNE | 30.09 | - | 75.4 | 76.6 | 66.2 | - | - | - |
| 2026-01-07 2300 | ESE | 11.7 | 13.6 | - | - | - | - | 30.09 | +0.03 | 75.2 | 76.6 | 65.8 | - | - | - |
| 2026-01-07 2250 | ESE | 11.7 | 13.6 | 5.9 | 10 | 6.5 | NNE | 30.09 | - | 75.2 | 76.6 | 66.0 | - | - | - |
| 2026-01-07 2240 | E | 11.7 | 13.6 | - | - | - | - | 30.09 | - | 75.2 | 76.6 | 66.4 | - | - | - |
| 2026-01-07 2230 | E | 9.7 | 13.6 | - | - | - | - | 30.09 | - | 75.2 | 76.6 | 66.7 | - | - | - |
| 2026-01-07 2220 | E | 9.7 | 11.7 | 5.6 | 11 | 6.3 | NNE | 30.09 | - | 75.2 | 76.6 | 66.6 | - | - | - |
| 2026-01-07 2210 | ESE | 9.7 | 11.7 | 5.6 | - | 6.3 | NNE | 30.09 | - | 75.2 | 76.6 | 66.0 | - | - | - |
| 2026-01-07 2200 | ESE | 9.7 | 11.7 | - | - | - | - | 30.09 | +0.04 | 75.2 | 76.6 | 66.0 | - | - | - |
| 2026-01-07 2150 | ESE | 9.7 | 11.7 | 5.9 | 11 | 6.5 | NNE | 30.09 | - | 75.2 | 76.6 | 66.4 | - | - | - |
| 2026-01-07 2140 | ESE | 9.7 | 11.7 | - | - | - | - | 30.09 | - | 75.2 | 76.6 | 66.2 | - | - | - |
| 2026-01-07 2130 | ESE | 9.7 | 11.7 | - | - | - | - | 30.08 | - | 75.2 | 76.6 | 65.8 | - | - | - |
| 2026-01-07 2120 | ESE | 9.7 | 11.7 | 5.9 | 10 | 6.3 | N | 30.08 | - | 75.2 | 76.6 | 65.8 | - | - | - |
| 2026-01-07 2110 | ESE | 9.7 | 13.6 | 5.9 | - | 6.3 | N | 30.08 | - | 75.2 | 76.6 | 66.2 | - | - | - |
| 2026-01-07 2100 | ESE | 9.7 | 13.6 | - | - | - | - | 30.08 | +0.02 | 75.2 | 76.6 | 66.0 | - | - | - |
| 2026-01-07 2050 | ESE | 11.7 | 13.6 | 6.2 | 10 | 6.5 | N | 30.07 | - | 75.4 | 76.6 | 66.4 | - | - | - |
| 2026-01-07 2040 | ESE | 11.7 | 13.6 | 6.2 | - | 6.5 | N | 30.06 | - | 75.2 | 76.6 | 66.2 | - | - | - |
| 2026-01-07 2030 | ESE | 11.7 | 13.6 | - | - | - | - | 30.06 | - | 75.2 | 76.6 | 66.4 | - | - | - |
| 2026-01-07 2020 | ESE | 11.7 | 13.6 | 6.2 | 11 | 6.2 | NNE | 30.06 | - | 75.2 | 76.6 | 66.7 | - | - | - |
| 2026-01-07 2010 | ESE | 11.7 | 13.6 | 6.2 | - | 6.2 | NNE | 30.06 | - | 75.0 | 76.6 | 66.7 | - | - | - |
| 2026-01-07 2000 | ESE | 11.7 | 13.6 | - | - | - | - | 30.06 | +0.00 | 75.2 | 76.6 | 67.1 | - | - | - |
| 2026-01-07 1950 | ESE | 9.7 | 13.6 | 7.2 | 11 | 6.9 | NNE | 30.06 | - | 75.2 | 76.6 | 67.1 | - | - | - |
| 2026-01-07 1940 | ESE | 11.7 | 13.6 | - | - | - | - | 30.06 | - | 75.2 | 76.6 | 66.9 | - | - | - |
| 2026-01-07 1930 | ESE | 9.7 | 13.6 | - | - | - | - | 30.06 | - | 75.2 | 76.6 | 66.6 | - | - | - |
| 2026-01-07 1920 | ESE | 11.7 | 13.6 | 6.6 | 7 | 6.4 | E | 30.06 | - | 75.0 | 76.6 | 66.4 | - | - | - |
| 2026-01-07 1910 | E | 9.7 | 13.6 | 6.6 | - | 6.4 | E | 30.05 | - | 75.0 | 76.6 | 66.7 | - | - | - |
| 2026-01-07 1900 | ESE | 11.7 | 13.6 | - | - | - | - | 30.05 | -0.04 | 75.0 | 76.6 | 66.9 | - | - | - |
| 2026-01-07 1850 | E | 11.7 | 13.6 | 6.9 | 10 | 6.4 | N | 30.05 | - | 75.0 | 76.6 | 66.9 | - | - | - |
|
These wave data are displayed in rounded times. Click on the graph icon in the table below to see a time series plot of the last five days of that observation. | |
| 3.6 ft | |
| 3.3 ft | |
| 12.9 sec | |
| NE | |
| 1.0 ft | |
| 3.3 sec | |
| E | |
| SWELL | |
| 6.1 sec | |
| TIME (GMT) |
WVHT ft |
SwH ft |
SwP sec |
SwD |
WWH ft |
WWP sec |
WWD |
STEEPNESS |
APD sec |
|---|---|---|---|---|---|---|---|---|---|
| 2026-01-08 1810 | 3.6 | 3.3 | 11.4 | NE | 1.0 | 4.0 | E | SWELL | 6.1 |
| 2026-01-08 1740 | 3.6 | 3.6 | 12.1 | NE | 1.0 | 3.6 | E | SWELL | 6.4 |
| 2026-01-08 1710 | 3.9 | 3.6 | 12.1 | NE | 1.0 | 4.0 | E | SWELL | 6.3 |
| 2026-01-08 1640 | 3.6 | 3.6 | 12.1 | NE | 1.0 | 4.0 | E | SWELL | 6.1 |
| 2026-01-08 1610 | 3.9 | 3.9 | 11.4 | NE | 1.0 | 4.0 | E | SWELL | 6.2 |
| 2026-01-08 1540 | 3.9 | 3.9 | 11.4 | NE | 1.0 | 4.0 | E | SWELL | 6.3 |
| 2026-01-08 1510 | 4.3 | 4.3 | 12.1 | NE | 1.0 | 4.0 | E | SWELL | 6.4 |
| 2026-01-08 1440 | 3.9 | 3.9 | 7.7 | NE | 1.3 | 3.8 | E | AVERAGE | 6.1 |
| 2026-01-08 1410 | 4.3 | 3.9 | 6.7 | ENE | 1.0 | 3.6 | E | STEEP | 6.1 |
| 2026-01-08 1340 | 3.9 | 3.9 | 11.4 | NE | 1.0 | 3.8 | E | SWELL | 6.1 |
| 2026-01-08 1310 | 3.9 | 3.9 | 12.1 | NE | 1.3 | 3.8 | E | SWELL | 6.1 |
| 2026-01-08 1240 | 4.3 | 3.9 | 11.4 | NE | 1.3 | 4.0 | ESE | SWELL | 6.1 |
| 2026-01-08 1210 | 4.3 | 4.3 | 10.8 | NE | 1.3 | 2.7 | ESE | SWELL | 6.0 |
| 2026-01-08 1140 | 4.6 | 4.3 | 12.1 | NE | 1.3 | 3.8 | ESE | SWELL | 6.2 |
| 2026-01-08 1110 | 4.6 | 4.3 | 9.1 | NNE | 1.3 | 3.8 | E | SWELL | 6.2 |
| 2026-01-08 1040 | 4.3 | 3.9 | 5.9 | ESE | 1.3 | 3.8 | ESE | STEEP | 5.9 |
| 2026-01-08 1010 | 4.6 | 4.6 | 9.1 | NNE | 1.3 | 3.4 | E | SWELL | 6.3 |
| 2026-01-08 0940 | 4.3 | 3.9 | 5.9 | ESE | 1.3 | 3.8 | ESE | STEEP | 6.0 |
| 2026-01-08 0910 | 4.9 | 4.6 | 5.9 | E | 1.3 | 3.4 | ESE | VERY_STEEP | 6.0 |
| 2026-01-08 0840 | 4.6 | 4.3 | 6.2 | E | 1.3 | 4.0 | ESE | STEEP | 6.0 |
| 2026-01-08 0810 | 4.9 | 4.6 | 9.1 | NNE | 1.6 | 4.2 | E | AVERAGE | 6.1 |
| 2026-01-08 0740 | 4.6 | 4.3 | 12.1 | ENE | 1.3 | 3.6 | ESE | SWELL | 6.0 |
| 2026-01-08 0710 | 4.3 | 4.3 | 9.1 | NNE | 1.6 | 3.8 | ESE | SWELL | 5.9 |
| 2026-01-08 0640 | 4.6 | 4.3 | 10.0 | NNE | 1.6 | 3.8 | SE | SWELL | 6.1 |
| 2026-01-08 0610 | 4.3 | 3.9 | 10.0 | NNE | 2.0 | 4.5 | E | SWELL | 5.8 |
| 2026-01-08 0540 | 4.9 | 4.6 | 10.0 | NE | 2.0 | 4.2 | E | SWELL | 6.1 |
| 2026-01-08 0510 | 4.6 | 4.3 | 6.7 | NE | 2.0 | 4.5 | E | STEEP | 5.8 |
| 2026-01-08 0440 | 4.6 | 4.3 | 9.1 | N | 2.3 | 5.0 | ENE | SWELL | 5.8 |
| 2026-01-08 0410 | 5.2 | 4.3 | 10.0 | NNE | 3.0 | 4.8 | E | SWELL | 5.9 |
| 2026-01-08 0340 | 4.9 | 4.3 | 10.0 | NNE | 2.3 | 5.0 | ESE | SWELL | 5.9 |
| 2026-01-08 0310 | 4.9 | 4.3 | 10.0 | NE | 2.3 | 4.5 | E | SWELL | 6.0 |
| 2026-01-08 0240 | 4.9 | 3.9 | 10.0 | NE | 2.6 | 5.6 | ESE | SWELL | 5.8 |
| 2026-01-08 0210 | 4.9 | 4.3 | 10.0 | NNE | 3.0 | 5.6 | E | SWELL | 5.9 |
| 2026-01-08 0140 | 5.2 | 4.3 | 12.1 | NE | 2.6 | 5.3 | ENE | SWELL | 5.9 |
| 2026-01-08 0110 | 5.2 | 4.3 | 10.8 | - | 2.6 | 4.3 | E | SWELL | 5.9 |
| 2026-01-08 0040 | 4.9 | 3.9 | 10.0 | NNE | 3.0 | 5.9 | E | SWELL | 5.9 |
| 2026-01-08 0010 | 5.2 | 4.3 | 10.8 | NNE | 3.3 | 5.6 | E | SWELL | 6.0 |
| 2026-01-07 2340 | 5.9 | 4.9 | 10.0 | N | 3.3 | 5.0 | E | SWELL | 6.1 |
| 2026-01-07 2310 | 5.6 | 5.2 | 10.8 | NNE | 2.6 | 5.3 | E | SWELL | 6.3 |
| 2026-01-07 2240 | 5.9 | 5.2 | 10.0 | NNE | 3.0 | 5.6 | E | SWELL | 6.5 |
| 2026-01-07 2210 | 5.6 | 5.2 | 10.8 | NNE | 2.0 | 4.2 | E | SWELL | 6.3 |
| 2026-01-07 2140 | 5.9 | 5.6 | 10.8 | NNE | 2.0 | 4.5 | E | SWELL | 6.5 |
| 2026-01-07 2110 | 5.9 | 5.2 | 10.0 | N | 2.3 | 4.3 | E | SWELL | 6.3 |
| 2026-01-07 2040 | 6.2 | 5.6 | 10.0 | N | 3.0 | 5.0 | ENE | SWELL | 6.5 |
| 2026-01-07 2010 | 6.2 | 5.6 | 10.8 | NNE | 3.0 | 4.5 | E | SWELL | 6.2 |
| 2026-01-07 1940 | 7.2 | 6.6 | 10.8 | NNE | 2.6 | 5.3 | ENE | SWELL | 6.9 |
| 2026-01-07 1910 | 6.6 | 5.9 | 6.7 | E | 2.6 | 5.0 | E | STEEP | 6.4 |
Links which are specific to this station are listed below:
Real Time Data in tabular form for the last forty-five days.
Historical Data & Climatic Summaries for quality controlled data for prior months and years.
The weekly status report and the weekly maintenance report also provide valuable station information.
Note that the payload types and the station locations occasionally change.