


![]() View the latest observations near Atlantic Tropical Storm Bertha and East Pacific Hurricane Fausto.
View the latest observations near Atlantic Tropical Storm Bertha and East Pacific Hurricane Fausto.
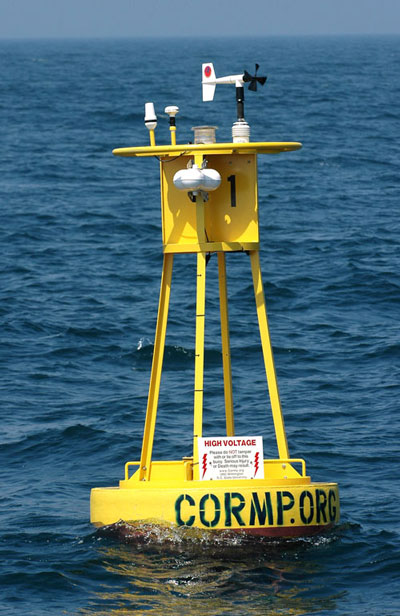
Station 41038 - Wrightsville Beach Nearshore, NC (ILM2) 
Owned and maintained by Coastal Ocean Research and Monitoring Program (CORMP)
Moored Buoy
34.141 N 77.715 W (34°8'27" N 77°42'53" W)
Site elevation: sea level
Air temp height: 2.79 m above site elevation
Anemometer height: 2.95 m above site elevation
Barometer elevation: 2.79 m above mean sea level
Sea temp depth: 1 m below water line
Water depth: 18 m
Data from a nearby waverider buoy (41110) can be viewed here.
(24 hours for tsunami stations)
|
Click on the graph icon in the table below to see a time series plot of the last five days of that observation. | |
| SSW ( 210 deg true ) | |
| 19.4 kts | |
| 25.3 kts | |
| 29.97 in | |
| 84.4 °F | |
| 81.9 °F | |
| 35.94 psu | |
| 77.7 °F | |
| 95.2 °F | |
| 23.3 kts | |
| 25.3 kts | |
| TIME (EDT) |
WDIR |
WSPD kts |
GST kts |
WVHT ft |
DPD sec |
APD sec |
MWD |
PRES in |
PTDY in |
ATMP °F |
WTMP °F |
DEWP °F |
SAL psu |
VIS nmi |
TIDE ft |
|---|---|---|---|---|---|---|---|---|---|---|---|---|---|---|---|
| 2026-07-22 02:08 pm | SSW | 19.4 | 25.3 | - | - | - | - | 29.99 | - | 84.2 | 81.7 | 77.7 | 35.94 | - | - |
| 2026-07-22 01:08 pm | SSW | 21.4 | 25.3 | - | - | - | - | 30.00 | - | 84.0 | 81.7 | 78.1 | 35.93 | - | - |
| 2026-07-22 12:08 pm | SSW | 19.4 | 25.3 | - | - | - | - | 29.98 | - | 83.3 | 81.7 | 77.5 | 35.92 | - | - |
| 2026-07-22 11:08 am | SSW | 17.5 | 25.3 | - | - | - | - | 30.00 | - | 83.8 | 81.5 | 77.9 | 35.92 | - | - |
| 2026-07-22 10:08 am | SSW | 17.5 | 25.3 | - | - | - | - | 29.99 | - | 83.7 | 81.5 | 77.7 | 35.93 | - | - |
| 2026-07-22 09:08 am | SSW | 19.4 | 25.3 | - | - | - | - | 29.99 | - | 83.7 | 81.5 | 77.7 | 35.93 | - | - |
| 2026-07-22 08:08 am | SSW | 19.4 | 23.3 | - | - | - | - | 29.98 | - | 83.5 | 81.5 | 77.5 | 35.93 | - | - |
| 2026-07-22 07:08 am | SSW | 19.4 | 25.3 | - | - | - | - | 29.96 | - | 83.5 | 81.5 | 77.5 | 35.93 | - | - |
| 2026-07-22 06:08 am | SSW | 17.5 | 23.3 | - | - | - | - | 29.94 | - | 83.3 | 81.5 | 77.5 | 35.93 | - | - |
| 2026-07-22 05:08 am | SSW | 19.4 | 25.3 | - | - | - | - | 29.93 | - | 83.5 | 81.3 | 77.7 | 35.93 | - | - |
| 2026-07-22 04:08 am | SSW | 21.4 | 27.2 | - | - | - | - | 29.92 | - | 83.5 | 81.5 | 77.5 | 35.93 | - | - |
| 2026-07-22 03:08 am | SSW | 21.4 | 27.2 | - | - | - | - | 29.93 | - | 83.7 | 81.7 | 77.7 | 35.93 | - | - |
| 2026-07-22 02:08 am | SSW | 19.4 | 27.2 | - | - | - | - | 29.95 | - | 83.5 | 81.9 | 77.9 | 35.91 | - | - |
| 2026-07-22 01:08 am | SSW | 21.4 | 27.2 | - | - | - | - | 29.95 | - | 83.8 | 82.6 | 77.7 | 35.86 | - | - |
| 2026-07-22 12:08 am | SSW | 21.4 | 31.1 | - | - | - | - | 29.94 | - | 83.8 | 83.1 | 78.1 | 35.84 | - | - |
| 2026-07-21 11:08 pm | SSW | 21.4 | 29.1 | - | - | - | - | 29.95 | - | 84.0 | 83.7 | 78.3 | 35.81 | - | - |
| 2026-07-21 10:08 pm | SSW | 21.4 | 27.2 | - | - | - | - | 29.95 | - | 84.4 | 84.2 | 77.5 | 35.67 | - | - |
| 2026-07-21 09:08 pm | SSW | 23.3 | 29.1 | - | - | - | - | 29.93 | - | 84.6 | 84.2 | 77.5 | 35.71 | - | - |
| 2026-07-21 08:08 pm | SSW | 21.4 | 29.1 | - | - | - | - | 29.93 | - | 84.7 | 84.4 | 77.5 | 35.78 | - | - |
| 2026-07-21 07:08 pm | SSW | 19.4 | 25.3 | - | - | - | - | 29.92 | - | 84.9 | 84.6 | 78.1 | 35.78 | - | - |
| 2026-07-21 06:08 pm | SSW | 19.4 | 27.2 | - | - | - | - | 29.92 | - | 84.9 | 84.7 | 78.6 | 35.76 | - | - |
| 2026-07-21 05:08 pm | SSW | 21.4 | 27.2 | - | - | - | - | 29.93 | - | 85.3 | 84.7 | 78.1 | 35.75 | - | - |
| 2026-07-21 04:08 pm | SSW | 19.4 | 27.2 | - | - | - | - | 29.95 | - | 85.1 | 84.7 | 79.2 | 35.75 | - | - |
|
These oceanographic data are displayed in rounded times. Click on the graph icon in the table below to see a time series plot of the last five days of that observation. | |
| Depth (DEPTH): | 0.0 ft |
| 81.79 °F | |
| 35.94 psu | |
| TIME (EDT) |
DEPTH ft |
OTMP °F |
COND mS/cm |
SAL psu |
O2% % |
O2PPM ppm |
CLCON ug/l |
TURB FTU |
PH |
EH mV |
|---|---|---|---|---|---|---|---|---|---|---|
| 2026-07-22 02:08 pm | 0.0 | 81.68 | - | 35.94 | - | - | - | - | - | - |
| 2026-07-22 01:08 pm | 0.0 | 81.63 | - | 35.93 | - | - | - | - | - | - |
| 2026-07-22 12:08 pm | 0.0 | 81.68 | - | 35.92 | - | - | - | - | - | - |
| 2026-07-22 11:08 am | 0.0 | 81.55 | - | 35.92 | - | - | - | - | - | - |
| 2026-07-22 10:08 am | 0.0 | 81.46 | - | 35.93 | - | - | - | - | - | - |
| 2026-07-22 09:08 am | 0.0 | 81.43 | - | 35.93 | - | - | - | - | - | - |
| 2026-07-22 08:08 am | 0.0 | 81.41 | - | 35.93 | - | - | - | - | - | - |
| 2026-07-22 07:08 am | 0.0 | 81.41 | - | 35.93 | - | - | - | - | - | - |
| 2026-07-22 06:08 am | 0.0 | 81.46 | - | 35.93 | - | - | - | - | - | - |
| 2026-07-22 05:08 am | 0.0 | 81.37 | - | 35.93 | - | - | - | - | - | - |
| 2026-07-22 04:08 am | 0.0 | 81.43 | - | 35.93 | - | - | - | - | - | - |
| 2026-07-22 03:08 am | 0.0 | 81.61 | - | 35.93 | - | - | - | - | - | - |
| 2026-07-22 02:08 am | 0.0 | 81.82 | - | 35.91 | - | - | - | - | - | - |
| 2026-07-22 01:08 am | 0.0 | 82.65 | - | 35.86 | - | - | - | - | - | - |
| 2026-07-22 12:08 am | 0.0 | 83.05 | - | 35.84 | - | - | - | - | - | - |
| 2026-07-21 11:08 pm | 0.0 | 83.66 | - | 35.81 | - | - | - | - | - | - |
| 2026-07-21 10:08 pm | 0.0 | 84.25 | - | 35.67 | - | - | - | - | - | - |
| 2026-07-21 09:08 pm | 0.0 | 84.20 | - | 35.71 | - | - | - | - | - | - |
| 2026-07-21 08:08 pm | 0.0 | 84.33 | - | 35.78 | - | - | - | - | - | - |
| 2026-07-21 07:08 pm | 0.0 | 84.58 | - | 35.78 | - | - | - | - | - | - |
| 2026-07-21 06:08 pm | 0.0 | 84.72 | - | 35.76 | - | - | - | - | - | - |
| 2026-07-21 05:08 pm | 0.0 | 84.79 | - | 35.75 | - | - | - | - | - | - |
| 2026-07-21 04:08 pm | 0.0 | 84.69 | - | 35.75 | - | - | - | - | - | - |
Links which are specific to this station are listed below:
Real Time Data in tabular form for the last forty-five days.
Historical Data & Climatic Summaries for quality controlled data for prior months and years.