


![]() View the latest observations near Atlantic Tropical Depression Two, East Pacific Tropical Depression Six-E and East Pacific Tropical Storm Elida.
View the latest observations near Atlantic Tropical Depression Two, East Pacific Tropical Depression Six-E and East Pacific Tropical Storm Elida.
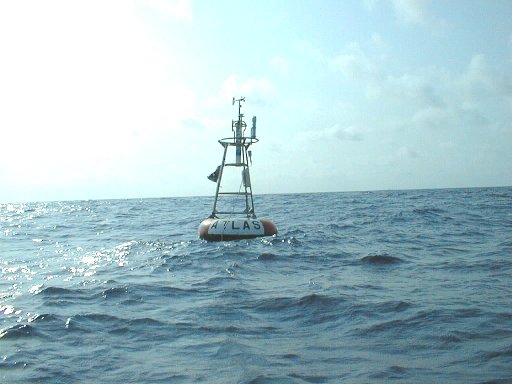
Station 15002 - Java 
Owned and maintained by the PIRATA Prediction and Research Moored Array in the Atlantic
Atlas Buoy
0.000 N 10.000 W (0°0'0" N 10°0'0" W)
Site elevation: sea level
Air temp height: 3 m above site elevation
Anemometer height: 4 m above site elevation
Barometer elevation: 3 m above mean sea level
(24 hours for tsunami stations)
|
Click on the graph icon in the table below to see a time series plot of the last five days of that observation. | |
| SSE ( 155 deg true ) | |
| 11.3 kts | |
| 73.2 °F | |
| 73.4 °F | |
| TIME (GMT) |
WDIR |
WSPD kts |
GST kts |
WVHT ft |
DPD sec |
APD sec |
MWD |
PRES in |
PTDY in |
ATMP °F |
WTMP °F |
DEWP °F |
SAL psu |
VIS nmi |
TIDE ft |
|---|---|---|---|---|---|---|---|---|---|---|---|---|---|---|---|
| 2026-07-19 0900 | SE | 11.5 | - | - | - | - | - | - | - | 72.9 | 73.0 | - | - | - | - |
| 2026-07-19 0700 | SE | 10.7 | - | - | - | - | - | - | - | 72.1 | 72.9 | - | - | - | - |
| 2026-07-19 0400 | SE | 10.1 | - | - | - | - | - | - | - | 72.1 | 73.0 | - | - | - | - |
| 2026-07-18 2200 | SE | 8.0 | - | - | - | - | - | - | - | 72.7 | 73.4 | - | - | - | - |
| 2026-07-18 2100 | SE | 8.2 | - | - | - | - | - | - | - | 72.7 | 73.4 | - | - | - | - |
| 2026-07-18 2000 | SSE | 7.8 | - | - | - | - | - | - | - | 72.7 | 73.4 | - | - | - | - |
Links which are specific to this station are listed below:
Real Time Data in tabular form for the last forty-five days.
Historical Data & Climatic Summaries for quality controlled data for prior months and years.