


![]() View the latest observations near East Pacific Hurricane Fausto and East Pacific Tropical Storm Genevieve.
View the latest observations near East Pacific Hurricane Fausto and East Pacific Tropical Storm Genevieve.
Deep-ocean Assessment and Reporting of Tsunamis (DART®)
Real-Time Tsunami Reporting from the Deep Ocean
Hugh B. Milburn, Alex I. Nakamura, Frank I. Gonzalez
NOAA, Pacific Marine Environmental Laboratory
7600 Sand Point Way NE
Seattle, WA 98115
Abstract - A 100-year historical database indicates that an average of five tsunamis per year occur in the Pacific and that during this period tsunamis have killed more than 50,000 people [1]. At present, U.S. coastal communities receive warnings based on shore-based seismic data and information from coastal sea level stations. An unacceptable 75% false alarm rate has prevailed. Direct measurement of tsunamis in the open ocean, followed by real-time reports to warning centers, could improve the assessment of the tsunami hazard. Tsunamis have been observed in the deep ocean as part of a research program; furthermore, a recent successful demonstration of a near real-time system has been completed. A surface mooring was deployed with an acoustic modem and a bottom pressure recorder in 2600 m of water. Pressure data was remotely collected from the seafloor via the acoustic modem and telemetered to shore via satellite. The deployment of an array of these moorings in the Pacific is under consideration.
I. Introduction
National awareness of the tsunami hazard has been heightened by eight tsunamis generated around the Pacific Rim in the last 4 years. The first occurred on 25 April 1992 off Cape Mendocino, California [2]. Although small, this tsunami was significant because it was generated by an earthquake at the southern end of the Cascadia Subduction Zone (CSZ), a region just offshore of the U.S. west coast, which many geophysicists believe capable of much larger earthquakes accompanied by large and destructive tsunamis [3]. The second was the tragically destructive tsunami that attacked the Nicaraguan coast on 1 September 1992, leaving more than
100 people dead and thousands homeless [4]. The third was generated on 12 December 1992 by a large earthquake off the north central coast of Flores Island, Indonesia, where more than 500 fatalities were attributed to the tsunami [5]. On 12 July 1993, the fourth devastating tsunami struck the central west coast of Hokkaido, Japan, and the small offshore island of Okushiri. Over 200 fatalities were confirmed, and property losses were estimated at US$1.5 billion [6]. Indonesia was struck a second time by a devastating tsunami on 3 June 1994 that attacked the south coasts of Java and Bali Islands, killing at least 300 people and destroying hundreds of homes [7]. On 4 October 1994, a magnitude 8.1 Mw earthquake off the Kuril Islands generated a large tsunami that caused considerable damage on Shikotan and Hokkaido islands [8]. Most recently, two destructive tsunamis occurred within 4 days of each other, on 17 February 1996, more than a hundred people were killed when a large tsunami attacked coastal communities on Irian Jaya, Indonesia, and on 21 February 1996 tsunami waves killed 12 people on the Peruvian coast.
U.S. congressional and public awareness of the tsunami hazard has also dramatically increased as a result of widely publicized research on hazards associated with the CSZ, as well as the recent Pacific rim tsunamis, reminders of the potentially disastrous effects of this phenomenon. The expectation is that similarly destructive tsunamis will be generated by future large earthquakes in both the CSZ and the Alaska-Aleutian Subduction Zone (AASZ). Only the exact time of these events is uncertain.
For any tsunami, two scenarios must be considered, characterized by the distance between the earthquake epicenter and the affected coastal community. This distance determines two critical factors that govern hazard mitigation strategy: the magnitude of the resulting disaster, and the time available to issue a warning. Communities at large epicentral distances (1000 km or more) experience far-field (or distant) tsunamis, which can cause significant damage and fatalities, but do not attack the coastline for hours. Communities at small epicentral distances (within 100 km or so) experience near-field (or local) tsunamis that commonly inflict greater damage and more fatalities within minutes of the earthquake main shock.
The distant tsunami problem has received the most attention to date, in terms of hazard mitigation efforts. These remain a serious U.S. problem, especially in the case of Hawaii, which is situated in a vulnerable position near the center of the Pacific basin. An important issue is false alarms. The Pacific Tsunami Warning System was established in 1948, and issues warnings on the basis of seismic data and sea level measurements from coastal tide stations. But such data do not provide direct verification that a destructive tsunami is propagating across the Pacific toward distant coastal communities. However, tsunami forecasters must err on the safe side, and understandably so. As a consequence, 15 of 20 warnings issued have been considered false alarms [9]. Unfortunately, such incidents not only undermine the credibility of the system, but are surprisingly expensive as well, and substantial economic benefits would result if they were reduced. In 1986, for example, the unnecessary tsunami evacuation of Honolulu shut down the entire island of Oahu. Such disruptions can cost millions of dollars to the local economy in terms of lost salaries, business revenue, and decreased productivity. Most recently, a very disruptive false alarm was issued for the tsunami generated on 4 October 1994 near Shikotan Island in the Kurils, north of Japan. Although destructive in the Kurils and northern Japan, the tsunami was quite small on the U.S. west coast, where evacuations of a number of communities were carried out [10]. The fear and disruption of a false alarm can itself put a population at physical risk; fatalities and injuries have occurred during such evacuations.
II. Instrumentation
A. Bottom Pressure Recorder
PMEL has developed a deep-ocean tsunami observation capability based on long-term (>1 year) deployments of bottom pressure recorders (BPRs) capable of accurately measuring tsunamis with amplitudes as small as 0.5 cm in water depth up to 6 km [11]. The sensor in the BPR is a Paroscientific, Inc. model 410K 0-10,000 psia piezoelectric Bourdon tube gauge that shows very stable characteristics and low noise. The signal from the sensor is a square wave with a frequency
around 36 kHz with a range of 3 kHz full scale. This frequency variable signal is mixed with a local oscillator and heterodyned into the range of 1 to 2 kHz. A hybrid period counting scheme samples the sensor frequency every 15 seconds. One 16-bit counter is used to count whole cycles in the 15-second sample window, and another 16-bit counter measures the time of the remaining fractional cycle from the trailing edge of the sample window. This scheme yields a least-bit resolution of 0.00035 psi, or approximately 0.25 mm of water. Pressure, temperature, and engineering data are stored on a hard disk drive. Alkaline batteries power the system for 12-month deployments.
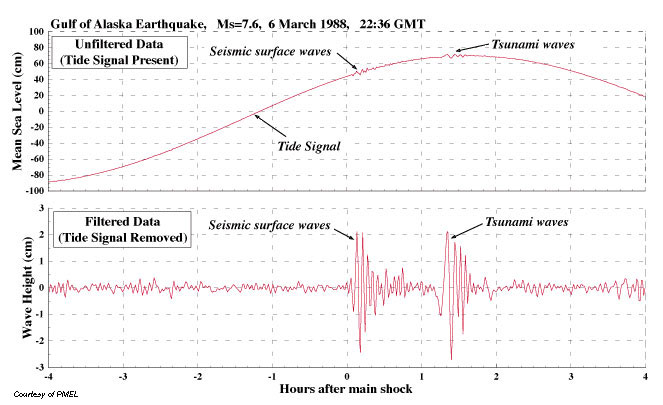
An array of 4 BPRs has been maintained in the north Pacific [12] since 1986. Data is shown in Fig. 1 from one unit located approximately 1000 km from the epicenter of a 1988 earthquake in the AASZ. Two types of waves were generated: seismic surface waves that induced vertical motion of the sea floor, and tsunami waves that caused displacement of the sea surface. Both waves were recorded by the BPR, each represented as one of the two distinct packets of energy shown in the record. The first packet is composed of the seismic waves that traveled at 11,000 km/hr to arrive at the gauge only minutes after the event. The second packet shows the tsunami waves that traveled at 800 km/hr to arrive 70 min after the earthquake. The recorded amplitudes of the seismic surface wave are greatly exaggerated by acceleration forces [13] but this record clearly demonstrates the ability of the BPR to measure these first arriving waves and the following tsunami.
B. Prototype Real-Time System
Deep ocean tsunamis can be detected by bottom moored pressure gauges, and the challenge of bringing that data ashore in a timely manner has now been addressed. A near real-time prototype tsunami reporting system has been designed using a surface buoy moored over a BPR as a relay point for tsunami data. It is not practical for technical reasons to make an electrical connection from the sea floor to the surface to transmit data. Using low-power digital signal processing capabilities, acoustic modems have been developed that are similar to the familiar telephone-based computer modem. We used the commercially available Datasonics ATM-845/851 modem pair in this experiment. They use a 1200-baud MFSK telemetry on the uplink and an 80-baud FSK telemetry on the downlink. With frequencies in the 16 to 18 kHz range and acoustic source levels of >190 db re 1 pa an effective range of 5 km or more is possible.
A BPR was modified to work with an ATM-845 bottom modem with communications through a serial RS232 standard. A 68HC11-based microcontroller was connected to the ATM-851 surface modem via a serial port and to an Argos satellite uplink transmitter. Both the top and bottom units were powered by alkaline batteries so power consumption was carefully controlled.
Considerable effort was expended on establishing a robust protocol for the remote acoustic telemetry between the surface and the bottom. The messages passed between the surface and subsurface unit are of fixed format containing a message integrity element. They contain a fixed 4-character header, the CRC (cyclic redundancy check) of the message block, a character count of the message block, the message type, and the message. The message can be a command or data. each message must be acknowledged either by an ASCII ACK or NAK character. The ACK character indicates that the receiver received the message intact, and the NAK indicates that the message was corrupted. If the sender receives a NAK or nothing in a fixed interval, it will resend the message. The sender will give up after 3 tries. The 4-character header provides a reference point in the message for the message interpreter. If at least one of the header characters is not corrupted, the interpreter will be able to decipher the message, provided that the CRC of the message is valid.
This demonstration experiment had the surface unit command the BPR to transmit data at set intervals. This was considered the most demanding test possible of the modem capabilities, as the uplink is more robust than the downlink. If the future brings a two-way satellite link from shore to the buoy it will be desirable to command the system to send data, which will necessitate a downlink capability. Data from this prototype system was transmitted via the polar orbiting NOAA TIROS satellite with an Argos Platform Transmit Terminal. Data was packed into 4 blocks of 32 bytes each and transmitted on a 90-second round robin schedule in a 4-hour window when a satellite was in view. This method is not acceptable for a real-time reporting system due to the inherent delay, but served as an expedient test platform. An operational mooring would send data via the NOAA GOES geostationary satellite or through one of the commercial low earth orbit satellites soon to be available.
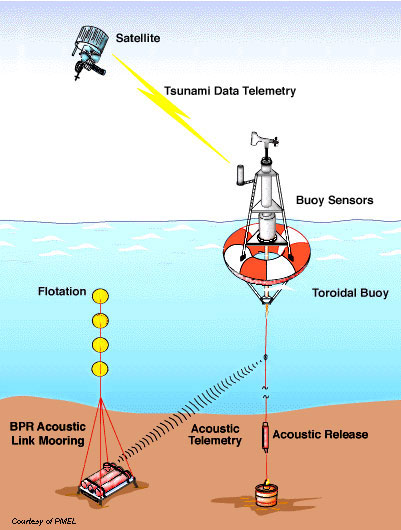
The mooring used in this experiment is a proven design that is reliable and inexpensive. The buoy is a simple fiberglass and foam structure with a taut moor of wire rope and nylon line to a clump anchor (Fig. 2). The acoustic transducer for the surface unit was mounted on the side of the buoy bridle at a depth of 1.2 m. It was surrounded on the sides and the top by a 0.4 m diameter by 0.2 m high cylindrical foam baffle in an attempt to minimize the effect of surface noise on the transducer.
C. Results of Field Experiment
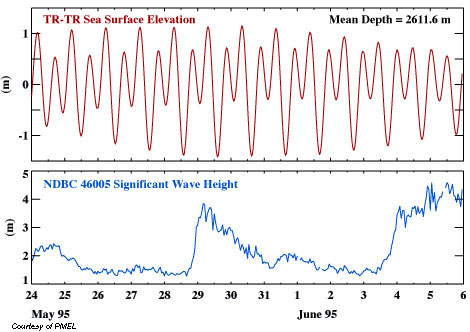
The prototype mooring was deployed at 46 28 N, 129 30 W in 2611 m of water on 23 May and recovered on 19 July 1995. The BPR was moored approximately 250 m from the anchor of the surface mooring. The BPR, acoustic modems, software protocols, and satellite data telemetry performed as expected throughout the 57-day period. Pressure data transmitted in engineering units were received daily and showed the dominant tidal cycles and the characteristic low drift of the Paros sensor.
The mooring was located within 70 km of a NOAA NDBC buoy, which reported winds and wave data. Although summer weather prevailed in the latter half of the deployment, significant wave heights exceeded 6 m on 11 June and winds of 10 m/sec or greater were common in June. There was no loss of data correlated with periods of high wind and waves. This indicated that surface wave noise and wave-driven buoy motion was not a factor in the acoustic modem performance. However, approximately 5% of the data were lost in the transmission cycle. On three occasions, engineering records indicate that the subsurface unit did not respond to commands from the surface unit. On nearly all other occasions the subsurface unit responded on the first request and the uplink worked without fail. The 60 beam pattern of the transducers, unknown BPR platform attitude, and the 1.4 km buoy watch circle may have contributed to the lost transmissions.
Although very successful, this experiment showed the necessity of quantifying the operating parameters of the modems and increasing the engineering data stored and transmitted. Wider beam transducers, possibly with higher power, will be evaluated. Gimbaling the subsurface transducer mounts or additional baffling of the surface transducer may improve the signal-to-noise ratio. Also, engineering efforts will be directed at refining modem protocols and evaluating satellite telemetry options. To complement any two-way telemetry scheme, algorithms will be developed for the BPR firmware that will detect a passing tsunami and initiate data transmission from the bottom unit. This scheme will be inherently more robust and, with hourly reporting of operational status, reliability of the mooring system could be assured.
III. Proposed Pacific Array
NOAA is proposing the establishment of a real-time reporting network of deep ocean tsunami detection buoys [14]. The rationale for this is straightforward. Coastal communities in Alaska, Hawaii, and on the U.S. west coast are threatened by tsunamis generated in the AASZ, the CSZ, and seismically active regions off South America and Kamchatka.
Detection systems strategically located seaward of known tsunami source regions will provide the needed verification within minutes of an earthquake through direct measurements. If no tsunami is detected, a false alarm will be averted. Conversely, if a tsunami is detected, the detection system will provide warning centers with the single most important piece of information required for decision-making: the deep ocean tsunami amplitude. Consequently, this system will not only decrease false alarms, but will also improve the speed and accuracy of true alarms.
The initial 6-element array proposed [14] is designed to protect the U.S. coastline by early detection of tsunamis generated in the AASZ (2 systems), the CSZ (2), and off the coasts of Kamchatka (1) and South America (1). These systems would also benefit other Pacific Rim countries, providing, for example, early detection for Japan of tsunamis generated off the South American coast. We believe that the successful deployment and maintenance of the initial network off eastern and northern Pacific seismic regions will spur an international effort to develop a similar network in the western Pacific.
IV. Summary/Acknowledgments
A prototype system for reporting tsunami data from the deep ocean has been demonstrated. Additional effort will be required to bring an operational system on line, but when fully developed and deployed, these moorings will aid significantly in tsunami hazard mitigation.
We gratefully acknowledge the assistance of C. Meinig for field operations, H. Mofjeld for tidal analysis, and J. Newman for data processing. This work was funded by NOAA/ERL. PMEL Contribution 1757.
References
[1] Lockridge, P.A., "Historical tsunamis in the Pacific basin," in Proc. Inter. Symp. Natural and Man-Made Hazards, M.I. El-Sabh and T.S. Murty, Eds., pp. 171-181, 1988.
[2] Gonzalez, F.I. and E.N. Bernard, "The Cape Mendocino Tsunami," Earthquakes and Volcanoes, vol. 23, pp. 135-138, 1992.
[3] Weaver, C.S., and K.M. Shedlock, "Estimates of seismic source regions from consideration of the earthquake distribution and regional tectonics in the Pacific Northwest," U.S. Geological Survey Open-File Report 91-441, 51 pp., 1992.
[4] Satake, K., Bourgeois, Ku. Abe, Ka. Abe, Y. Tsuji, F. Imamura, Y. Ito, H. Katao, E. Noguera and F. Estrada, "Tsunami field survey of the 1992 Nicaragua earthquake," Eos, Trans. AGU, Vol. 74, pp. 156-157, 1993.
[5] Tsuji, Y., H. Matsutomi, F. Imamura, M. Takeo, Y. Kawata, M. Matsuyama, T. Takahashi, Sonarjo and P. Harjadi, "Damage to coastal villages due to the 1992 Flores Island earthquake tsunami," in Tsunamis: 1992-1994, Their Generation, Dynamics and Hazard, K. Satake and F. Imamura, Eds., Birkhauser Verlag, pp. 481-524, 1995.
[6] Bernard, E.N. and F.I. Gonzalez (Hokkaido Tsunami Survey Group), "Tsunami devastates Japanese coastal region," Eos Trans. AGU, Vol. 74, No. 37, pp. 417, 432, 1993.
[7] Tsuji, Y., F. Imamura, H. Matsutomi, C.E. Synolakis, P.T. Nanang, Jamadi, S. Harada, S.S. Han, K. Arai and B. Cook, "Field survey of the East Java earthquake and tsunami of June 3, 1994," In: Tsunamis: 1992-1994, Their Generation, Dynamics and Hazard, K. Satake and F. Imamura, Eds., Birkhauser Verlag, pp. 839-854, 1995.
[8] Yeh, H., V. Titov, V. Gusiakov, E. Pelinovsky, V. Khramushin and V. Kaistrenko, "The 1994 Shikotan earthquake tsunamis, In: Tsunamis: 1992-1994, Their Generation, Dynamics and Hazard, K. Satake and F. Imamura, Eds., Birkhauser Verlag, pp. 855-874, 1995.
[9] Yanagi, B.S., "Tsunami Preparedness in Hawaii," in Coastal Earthquakes and Tsunamis: Reducing the Risks, J.W. Charland and J.W. Good, Eds., Corvallis, OR, Oregon Sea Grant, 1996.
[10] Good, J.W., "Tsunami Education Planning Workshop Findings and Recommendations," Appendix E, NOAA Technical Memorandum ERL PMEL-106, 41 pp., 1995.
[11] M.C. Eble and F.I. Gonzalez, "Deep-ocean bottom pressure measurements in the northeast Pacific," J. Atmos. Oceanic Tech., Vol. 8, No. 2, pp. 221-233, 1991.
[12] Gonzalez, F.I., E.N. Bernard, H.B. Milburn, D. Castel, J. Thomas, and J.M. Hemsley, "The Pacific tsunami observation program (PacTOP)," Proc. 1987 Inter. Tsunami Symp., IUGG, pp. 3-19, 1987.
[13] J.H. Filloux, "Tsunami recorded on the open ocean floor," Geophys. Res. Lett., Vol. 9, 25-28, 1982.
[14] E.N. Bernard, "Reducing tsunami hazards along U.S. coastlines," in Perspectives on Tsunami Hazard Reduction, Proceedings of the 1995 IUGG Tsunami Symposium, Kluwer Academic Publishers, (in press), 1996.
Back to DART® Prototype Test Deployment Page