


Station 44029 - Buoy A01 - Massachusetts Bay 
Owned and maintained by Northeastern Regional Association of Coastal Ocean Observing Systems
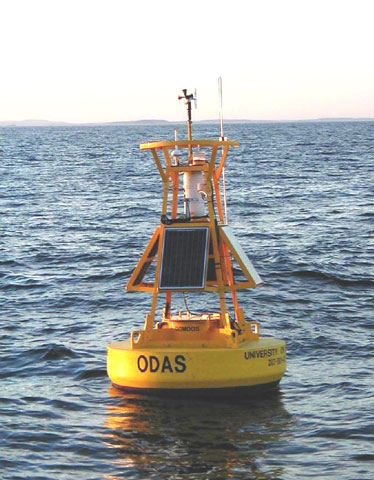
Moored Buoy
42.523 N 70.566 W (42°31'24" N 70°33'56" W)
Site elevation: sea level
Air temp height: 3 m above site elevation
Anemometer height: 4 m above site elevation
Barometer elevation: 3 m above mean sea level
Sea temp depth: 1 m below water line
Water depth: 65 m
Watch circle radius: 45 yards
(24 hours for tsunami stations)
|
Click on the graph icon in the table below to see a time series plot of the last five days of that observation. | |
| SSW ( 210 deg true ) | |
| 9.7 kts | |
| 11.7 kts | |
| 1.3 ft | |
| 8 sec | |
| 30.52 in | |
| 45.5 °F | |
| 45.0 °F | |
| 30.10 psu | |
| 1.6 nmi | |
| 40.1 °F | |
| 9.7 kts | |
| 11.7 kts | |
| TIME (EDT) |
WDIR |
WSPD kts |
GST kts |
WVHT ft |
DPD sec |
APD sec |
MWD |
PRES in |
PTDY in |
ATMP °F |
WTMP °F |
DEWP °F |
SAL psu |
VIS nmi |
TIDE ft |
|---|---|---|---|---|---|---|---|---|---|---|---|---|---|---|---|
| 2024-04-26 11:04 pm | SSW | 7.8 | 9.7 | 1.6 | 8 | - | - | 30.51 | - | 45.9 | 45.0 | - | 30.10 | 1.6 | - |
| 2024-04-26 10:04 pm | S | 9.7 | 13.6 | 1.6 | 3 | - | - | 30.50 | - | 46.2 | 45.1 | - | 30.10 | 1.6 | - |
| 2024-04-26 09:04 pm | S | 11.7 | 15.5 | 1.6 | 3 | - | - | 30.49 | - | 46.4 | 45.1 | - | 30.10 | 1.6 | - |
| 2024-04-26 08:04 pm | S | 11.7 | 15.5 | 2.0 | 8 | - | - | 30.48 | - | 46.0 | 45.1 | - | 30.10 | 1.6 | - |
| 2024-04-26 07:04 pm | S | 9.7 | 11.7 | 1.6 | 8 | - | - | 30.48 | - | 46.0 | 45.3 | - | 30.10 | 1.6 | - |
| 2024-04-26 06:04 pm | S | 9.7 | 11.7 | 1.6 | 8 | - | - | 30.48 | - | 45.9 | 45.5 | - | 30.10 | 1.6 | - |
| 2024-04-26 05:04 pm | SSE | 9.7 | 9.7 | 1.3 | 8 | - | - | 30.48 | - | 45.9 | 45.9 | - | 30.10 | 1.6 | - |
| 2024-04-26 04:04 pm | S | 9.7 | 11.7 | - | - | - | - | 30.48 | - | 45.5 | 46.2 | - | 30.10 | 1.6 | - |
| 2024-04-26 03:04 pm | SSE | 7.8 | 9.7 | 1.0 | 3 | - | - | 30.48 | - | 45.1 | 46.2 | - | 30.20 | 1.6 | - |
| 2024-04-26 02:04 pm | SE | 7.8 | 7.8 | 1.3 | 3 | - | - | 30.50 | - | 44.8 | 45.9 | - | 30.10 | 1.6 | - |
| 2024-04-26 01:04 pm | E | 7.8 | 9.7 | 1.3 | 3 | - | - | 30.50 | - | 44.4 | 45.9 | - | 30.20 | 1.6 | - |
| 2024-04-26 12:04 pm | NE | 5.8 | 7.8 | 1.3 | 4 | - | - | 30.52 | - | 45.0 | 45.7 | - | 30.20 | 1.6 | - |
| 2024-04-26 11:04 am | ENE | 5.8 | 7.8 | 2.0 | 4 | - | - | 30.53 | - | 45.0 | 45.1 | - | 30.20 | 1.6 | - |
| 2024-04-26 10:04 am | NE | 9.7 | 9.7 | 1.3 | 4 | - | - | 30.53 | - | 44.8 | 44.8 | - | 30.20 | 1.6 | - |
| 2024-04-26 09:04 am | NE | 11.7 | 13.6 | 1.3 | 3 | - | - | 30.52 | - | 44.8 | 44.6 | - | 30.20 | 1.6 | - |
| 2024-04-26 08:04 am | NE | 13.6 | 15.5 | 1.0 | 2 | - | - | 30.50 | - | 44.8 | 44.6 | - | 30.20 | 1.3 | - |
| 2024-04-26 07:04 am | N | 7.8 | 11.7 | 1.3 | 8 | - | - | 30.49 | - | 43.0 | 44.6 | - | 30.10 | 1.4 | - |
| 2024-04-26 06:04 am | N | 5.8 | 7.8 | 1.3 | 11 | - | - | 30.47 | - | 41.0 | 44.6 | - | 30.20 | 1.6 | - |
| 2024-04-26 05:04 am | WNW | 7.8 | 9.7 | 1.6 | 8 | - | - | 30.44 | - | 41.2 | 44.6 | - | 30.10 | 1.6 | - |
| 2024-04-26 04:04 am | NW | 9.7 | 11.7 | 1.6 | 8 | - | - | 30.42 | - | 42.3 | 44.6 | - | 30.20 | 1.6 | - |
| 2024-04-26 03:04 am | W | 9.7 | 11.7 | 1.6 | 3 | - | - | 30.40 | - | 43.2 | 44.6 | - | 30.20 | 1.6 | - |
| 2024-04-26 02:04 am | WSW | 11.7 | 13.6 | 1.6 | 3 | - | - | 30.40 | - | 43.0 | 44.8 | - | 30.20 | 1.6 | - |
Disclaimer: Ocean current directions are reported to the nearest 10 degrees and speeds are measured to the nearest whole centimeter per second.
Ocean Current Data for 44029
| 12:04 am EDT | 11:04 pm EDT | |||
|---|---|---|---|---|
| Depth ft | Dir ° | Speed kts |
Dir ° | Speed kts |
| 7 | 160 | 0.14 | 110 | 0.21 |
| 33 | 130 | 0.10 | 90 | 0.19 |
| 46 | 170 | 0.04 | 90 | 0.12 |
| 59 | 270 | 0.08 | 20 | 0.04 |
| 72 | 290 | 0.12 | 330 | 0.17 |
| 85 | 300 | 0.29 | 320 | 0.21 |
| 98 | 290 | 0.35 | 300 | 0.27 |
| 112 | 280 | 0.31 | 290 | 0.35 |
| 125 | 280 | 0.33 | 280 | 0.33 |
| 138 | 290 | 0.39 | 290 | 0.33 |
| 151 | 300 | 0.37 | 300 | 0.39 |
| 164 | 300 | 0.29 | 310 | 0.37 |
| 177 | 320 | 0.29 | 310 | 0.35 |
| 190 | 320 | 0.27 | 310 | 0.33 |
Previous (up to 48) reports of ocean current data for 44029
Ocean Current Stick Plots are available in metric units only:
All Instruments -  1-day plot 3-day plot 5-day plot
|
These oceanographic data are displayed in rounded times. Click on the graph icon in the table below to see a time series plot of the last five days of that observation. | |
| Depth (DEPTH): | 3.3 ft |
| 44.96 °F | |
| 30.10 psu | |
| TIME (EDT) |
DEPTH ft |
OTMP °F |
COND mS/cm |
SAL psu |
O2% % |
O2PPM ppm |
CLCON ug/l |
TURB FTU |
PH |
EH mv |
|---|---|---|---|---|---|---|---|---|---|---|
| 2024-04-26 11:04 pm | 3.3 | 44.96 | - | 30.10 | - | - | - | - | - | - |
| 2024-04-26 10:04 pm | 3.3 | 45.14 | - | 30.10 | - | - | - | - | - | - |
| 2024-04-26 09:04 pm | 3.3 | 45.14 | - | 30.10 | - | - | - | - | - | - |
| 2024-04-26 08:04 pm | 3.3 | 45.14 | - | 30.10 | - | - | - | - | - | - |
| 2024-04-26 07:04 pm | 3.3 | 45.32 | - | 30.10 | - | - | - | - | - | - |
| 2024-04-26 06:04 pm | 3.3 | 45.50 | - | 30.10 | - | - | - | - | - | - |
| 2024-04-26 05:04 pm | 3.3 | 45.86 | - | 30.10 | - | - | - | - | - | - |
| 2024-04-26 04:04 pm | 3.3 | 46.22 | - | 30.10 | - | - | - | - | - | - |
| 2024-04-26 03:04 pm | 3.3 | 46.22 | - | 30.20 | - | - | - | - | - | - |
| 2024-04-26 02:04 pm | 3.3 | 45.86 | - | 30.10 | - | - | - | - | - | - |
| 2024-04-26 01:04 pm | 3.3 | 45.86 | - | 30.20 | - | - | - | - | - | - |
| 2024-04-26 12:04 pm | 3.3 | 45.68 | - | 30.20 | - | - | - | - | - | - |
| 2024-04-26 11:04 am | 3.3 | 45.14 | - | 30.20 | - | - | - | - | - | - |
| 2024-04-26 10:04 am | 3.3 | 44.78 | - | 30.20 | - | - | - | - | - | - |
| 2024-04-26 09:04 am | 3.3 | 44.60 | - | 30.20 | - | - | - | - | - | - |
| 2024-04-26 08:04 am | 3.3 | 44.60 | - | 30.20 | - | - | - | - | - | - |
| 2024-04-26 07:04 am | 3.3 | 44.60 | - | 30.10 | - | - | - | - | - | - |
| 2024-04-26 06:04 am | 3.3 | 44.60 | - | 30.20 | - | - | - | - | - | - |
| 2024-04-26 05:04 am | 3.3 | 44.60 | - | 30.10 | - | - | - | - | - | - |
| 2024-04-26 04:04 am | 3.3 | 44.60 | - | 30.20 | - | - | - | - | - | - |
| 2024-04-26 03:04 am | 3.3 | 44.60 | - | 30.20 | - | - | - | - | - | - |
| 2024-04-26 02:04 am | 3.3 | 44.78 | - | 30.20 | - | - | - | - | - | - |
Links which are specific to this station are listed below:
Real Time Data in tabular form for the last forty-five days.
Historical Data & Climatic Summaries for quality controlled data for prior months and years.