Skip Navigation Links weather.gov 
NOAA logo-Select to go to the NOAA homepage NDBC Title GraphicClick to go to NDBC home page   Select to go to the NWS homepage
Home News Organization


    Station List

 Observations
    Mobile Access
    Obs via Google Maps
    Classic Maps
         Recent
         Historical
         DART®
         Oil & Gas ADCP
    Obs Search
    Ship Obs Report
    Gliders
    APEX
    TAO
    DODS
    HF Radar
    OSMC
    Dial-A-Buoy
    RSS Feeds Image indicating link to RSS feed access page
    Obs Web Widget
    Email Access

 Station Status
    NDBC Maintenance
    NDBC Platforms
    Partner Platforms

 Program Info
    Facebook Logo
    NDBC on Facebook
    About NDBC
     Met/Ocean
          Moored Buoy
          C-MAN
    TAO
    DART®
    VOS
    CSP
    IOOS® Program
    IOOS® DAC

 Publications
    NDBC DQC Handbook
    Hurricane Data Plots
    Mariners Weather
      Log

    Observing
      Handbook No. 1


 Science Education

 NDBC Director
 FAQ
 Media Inquiries
 Contact Us
 Visitor Information
 Links
 
USA.gov is the U.S. government's official web portal to all federal, state and local government web resources and services.

See recent photos from TAO buoy 8N 110W

Station 41036 (LLNR 802) - Onslow Bay Outer, NC Image indicating link to RSS feed of recent meteorological observations for station 41036

Station 41036

Funding provided by the University of North Carolina, Wilmington
Owned and maintained by National Data Buoy Center
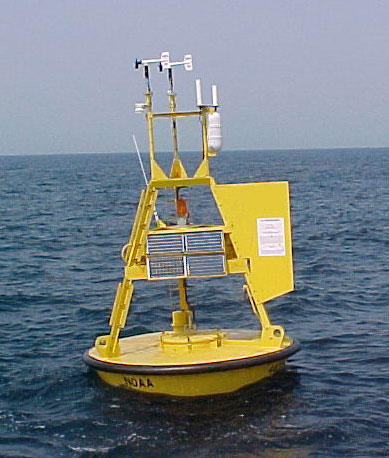
3-meter discus buoy
AMPS payload
34.207 N 76.949 W (34°12'25" N 76°56'56" W)

Site elevation: sea level
Air temp height: 4 m above site elevation
Anemometer height: 5 m above site elevation
Barometer elevation: sea level
Sea temp depth: 0.6 m below site elevation
Water depth: 25 m
Watch circle radius: 120 yards

Latest NWS Marine Forecast

Important Notice to Mariners

Search And Rescue (SAR) Data

Meteorological Observations from Nearby Stations and Ships Image indicating link to RSS feed of recent meteorological observations near station 41036

Regional HF Radar Surface Current Observations


Conditions at 41036 as of
(12:20 pm EDT)
1620 GMT on 05/20/2013:
Unit of Measure:    Time Zone:   

Click on the graph icon in the table below to see a time series plot of the last five days of that observation.

5-day plot - Wind Direction Wind Direction (WDIR): SSW ( 210 deg true )
5-day plot - Wind Speed Wind Speed (WSPD): 11.7 kts
5-day plot - Wind Gust Wind Gust (GST): 13.6 kts
5-day plot - Atmospheric Pressure Atmospheric Pressure (PRES): 30.16 in
5-day plot - Air Temperature Air Temperature (ATMP): 73.2 °F
5-day plot - Water Temperature Water Temperature (WTMP): 69.6 °F
5-day plot - Dew Point Dew Point (DEWP): 67.1 °F
5-day plot - Wind Speed at 10 Meters Wind Speed at 10 meters (WSPD10M): 11.7 kts
5-day plot - Wind Speed at 10 Meters Wind Speed at 20 meters (WSPD20M): 13.6 kts
5-day plot - Wind Speed, Wind Gust and Atmospheric Pressure Combined plot of Wind Speed, Gust, and Air Pressure
Continuous Winds
TIME
(EDT)
5-day plot - Wind Direction WDIR 5-day plot - Wind Speed WSPD
12:20 pmSSW ( 207 deg ) 11.3 kts
12:10 pmSSW ( 207 deg ) 12.0 kts
12:00 pmSSW ( 208 deg ) 11.8 kts
11:50 amSSW ( 209 deg ) 11.5 kts
11:40 amSSW ( 208 deg ) 11.1 kts
11:30 amSSW ( 208 deg ) 11.3 kts
 
Peak gust during the measurement hour
TIME
(EDT)
5-day plot - Gust Direction GDR 5-day plot - Gust Speed GST
12:09 pmSSW ( 210 deg ) 13.6 kts
Previous observations
5-day plot - Wind Direction 5-day plot - Wind Speed 5-day plot - Wind Gust 5-day plot - Wave Height 5-day plot - Dominant Wave Period 5-day plot - Average Period 5-day plot - Mean Wave Direction 5-day plot - Atmospheric Pressure 5-day plot - Pressure Tendency 5-day plot - Air Temperature 5-day plot - Water Temperature 5-day plot - Dew Point 5-day plot - Salinity 5-day plot - Visibility 5-day plot - Tide (above MLLW)
MM DD TIME
(EDT)
   WDIR WSPD
kts
GST
kts
WVHT
ft
DPD
sec
APD
sec
MWD PRES
in
PTDY
in
ATMP
°F
WTMP
°F
DEWP
°F
SAL
psu
VIS
nmi
TIDE
ft
052011:50 am  SSW 11.7 13.6 5.6 65.2 SE30.17-0.01 73.2 69.6 66.7---
052011:20 am  SSW 9.7 13.6----30.17- 73.0 69.4 67.8---
052010:50 am  SSW 9.7 11.7 5.2 65.3 SE30.18+0.01 73.2 69.4 67.6---
052010:20 am  SSW 11.7 13.6----30.18- 73.4 69.4 67.5---
0520 9:50 am  SSW 11.7 13.6 4.9 65.3 SE30.18+0.03 73.6 69.4 66.9---
0520 9:20 am  SSW 9.7 11.7----30.18- 73.4 69.4 66.9---
0520 8:50 am  SSW 9.7 9.7 4.9 75.2ESE30.18+0.05 73.2 69.6 66.7---
0520 8:20 am  SSW 11.7 13.6----30.17- 73.6 69.8 66.4---
0520 7:50 am  SSW 9.7 11.7 5.2 65.2 SE30.16+0.05 73.4 70.2 67.5---
0520 7:20 am  SSW 11.7 13.6----30.15- 73.4 70.3 67.6---
0520 6:50 am  SSW 11.7 13.6 4.6 65.1 SE30.15+0.03 73.4 70.7 68.5---
0520 6:20 am   S 11.7 15.5----30.14- 73.6 71.1 69.4---
0520 5:50 am   S 13.6 15.5 4.6 55.2SSE30.13+0.00 73.2 71.6 69.3---
0520 5:20 am   S 13.6 15.5----30.12- 74.3 72.0 68.0---
0520 4:50 am   S 11.7 15.5 4.9 65.0 SE30.12-0.02 74.3 72.1 67.5---
0520 4:20 am  SSW 9.7 11.7----30.12- 73.9 72.3 66.9---
0520 3:50 am  SSW 11.7 13.6 4.9 54.9 SE30.11-0.04 74.3 72.3 66.9---
0520 3:20 am  SSW 13.6 17.5----30.12- 74.3 72.5 64.9---
0520 2:50 am  SSW 15.5 17.5 4.6 54.9 SE30.13-0.05 73.9 72.7 67.6---
0520 2:20 am   S 11.7 13.6----30.13- 74.1 72.9 69.4---
0520 1:50 am   S 11.7 13.6 4.6 54.7 SE30.14-0.03 73.9 73.0 68.5---
0520 1:20 am   S 13.6 17.5----30.15- 73.6 73.0 64.6---
052012:50 am   S 13.6 17.5 4.3 54.9SSE30.16+0.00 73.4 73.0 67.6---
052012:20 am  SSE 15.5 21.4----30.17- 69.4 73.2 67.1---
051911:50 pm   S 9.7 17.5 3.9 54.8SSE30.17+0.03 73.0 73.4 68.7---
051911:20 pm   S 9.7 11.7----30.17- 72.5 73.4 69.3---
051910:50 pm   S 13.6 17.5 3.6 64.8 E30.17+0.03 72.5 73.2 68.0---
051910:20 pm   S 11.7 15.5----30.18- 73.6 73.2 70.3---
0519 9:50 pm   S 11.7 13.6 3.9 44.7 SE30.16+0.03 73.0 73.2 69.4---
0519 9:20 pm  SSE 13.6 15.5----30.16- 70.9 73.2 68.0---
0519 8:50 pm   S 19.4 25.3 3.6 54.8SSE30.14+0.01 72.9 73.4 68.0---
0519 8:20 pm  SSE 13.6 17.5----30.14- 73.4 73.8 67.8---
0519 7:50 pm   S 7.8 9.7 3.3 85.2ESE30.14+0.01 74.3 74.3 69.4---
0519 7:20 pm  SSW 5.8 7.8----30.14- 74.8 74.7 69.1---
0519 6:50 pm  SSW 7.8 7.8 3.3 95.1ESE30.13+0.00 75.4 74.8 68.0---
0519 6:20 pm  SSW 7.8 9.7----30.14- 75.4 75.0 68.5---
0519 5:50 pm   S 7.8 9.7 3.3 85.1ESE30.13-0.01 75.4 75.2 68.2---
0519 5:20 pm   S 9.7 11.7----30.13- 75.6 75.2 67.5---
0519 4:50 pm   S 9.7 11.7 3.0 54.8SSE30.13-0.02 75.6 75.4 67.3---
0519 4:20 pm   S 9.7 11.7----30.13- 75.6 75.2 66.7---
0519 3:50 pm   S 7.8 9.7 3.3 94.8ESE30.13-0.05 75.6 75.2 66.6---
0519 3:20 pm   S 9.7 11.7----30.13- 75.7 75.4 66.2---
0519 2:50 pm   S 9.7 9.7 3.3 84.8ESE30.15-0.05 75.6 75.4 66.6---
0519 2:20 pm   S 9.7 11.7----30.16- 75.6 75.2 66.7---
0519 1:50 pm   S 9.7 11.7 3.0 85.0ESE30.16-0.04 75.6 75.4 67.6---
0519 1:20 pm   S 9.7 11.7----30.17- 75.4 74.8 67.3---
051912:50 pm   S 7.8 9.7 3.0 85.0ESE30.18-0.02 74.8 74.8 68.9---

Detailed Wave Summary
for 41036 as of (12:00 pm EDT)
1600 GMT on 05/20/2013:

These wave data are displayed in rounded times.

Unit of Measure:    Time Zone:   

Click on the graph icon in the table below to see a time series plot of the last five days of that observation.

5-day plot - Significant Wave HeightSignificant Wave Height (WVHT): 5.6 ft
5-day plot - Swell HeightSwell Height (SwH): 4.3 ft
5-day plot - Swell PeriodSwell Period (SwP): 6.2 sec
5-day plot - Swell DirectionSwell Direction (SwD): SE
5-day plot - Wind Wave HeightWind Wave Height (WWH): 3.6 ft
5-day plot - Wind Wave PeriodWind Wave Period (WWP): 5.6 sec
5-day plot - Wind Wave DirectionWind Wave Direction (WWD):SSE
5-day plot - Wave SteepnessWave Steepness (STEEPNESS):VERY_STEEP
5-day plot - Average Wave PeriodAverage Wave Period (APD): 5.2 sec
Previous observations
5-day plot - Significant Wave Height 5-day plot - Swell Height 5-day plot - Swell Period 5-day plot - Swell Direction 5-day plot - Wind Wave Height 5-day plot - Wind Wave Period 5-day plot - Wind Wave Direction 5-day plot - Wave Steepness 5-day plot - Average Wave Period
MM DD TIME
(EDT)
  WVHT
ft
  SwH
ft
  SwP
sec
  SwD WWH
ft
WWP
sec
  WWD STEEPNESS APD
sec
052011:00 am   5.2   4.3   6.2   SE 2.6 3.8   S STEEP 5.3
052010:00 am   4.9   3.0   6.7   E 3.9 5.9   SEVERY_STEEP 5.3
0520 9:00 am   4.9   4.3   6.7  ESE 2.3 4.2   SSE STEEP 5.2
0520 8:00 am   5.2   4.3   5.6   SE 3.0 4.0   SSEVERY_STEEP 5.2
0520 7:00 am   4.6   3.6   5.9   SE 3.3 4.5   SEVERY_STEEP 5.1
0520 6:00 am   4.6   2.6   7.1   E 3.9 5.0   SSEVERY_STEEP 5.2
0520 5:00 am   4.9   3.0   6.7   E 3.9 5.6   SEVERY_STEEP 5.0
0520 4:00 am   4.9   2.6   9.1  ESE 3.9 5.3   SEVERY_STEEP 4.9
0520 3:00 am   4.6   2.0   10.8   E 3.9 5.0   SEVERY_STEEP 4.9
0520 2:00 am   4.6   3.0   5.9  ESE 3.3 5.3   SEVERY_STEEP 4.7
0520 1:00 am   4.3   2.0   10.0   E 3.9 5.3   SSEVERY_STEEP 4.9
052012:00 am   3.9   3.0   5.0  SSE 2.3 4.5   SEVERY_STEEP 4.8
051911:00 pm   3.6   2.0   7.7   E 3.3 6.2   E STEEP 4.8
051910:00 pm   3.9   2.6   5.6  SSE 3.0 4.3   SEVERY_STEEP 4.7
0519 9:00 pm   3.6   2.0   7.7   E 3.0 5.3   SSEVERY_STEEP 4.8
0519 8:00 pm   3.3   3.3   8.3  ESE 1.3 3.7   SSE SWELL 5.2
0519 7:00 pm   3.3   3.0   9.1  ESE 1.3 3.8   S SWELL 5.1
0519 6:00 pm   3.3   3.0   8.3  ESE 1.3 4.0   SSE SWELL 5.1
0519 5:00 pm   3.0   2.6   4.8  SSE 1.6 3.6   SVERY_STEEP 4.8
0519 4:00 pm   3.3   2.6   9.1  ESE 1.6 3.6   SSE SWELL 4.8
0519 3:00 pm   3.3   2.6   8.3  ESE 1.6 4.2   SE SWELL 4.8
0519 2:00 pm   3.0   2.3   8.3  ESE 1.6 4.2   SSE SWELL 5.0
0519 1:00 pm   3.0   2.6   8.3  ESE 1.3 3.4   SSE SWELL 5.0

Plot of wave energy versus frequency (and period)


Ocean Current Data for 41036

Unit of Measure:   Time Zone:   
   12:33 pm EDT   12:03 pm EDT   11:33 am EDT   11:03 am EDT   10:33 am EDT   10:03 am EDT    9:33 am EDT    9:03 am EDT
Depth
ft
   Dir
°
Speed
kts
   Dir
°
Speed
kts
   Dir
°
Speed
kts
   Dir
°
Speed
kts
   Dir
°
Speed
kts
   Dir
°
Speed
kts
   Dir
°
Speed
kts
   Dir
°
Speed
kts
7     30 0.21    30 0.12    50 0.14    60 0.12    60 0.21    70 0.19    90 0.23    90 0.25

Previous 24 hours of ocean current data for 41036

Ocean Current Stick Plots are available in metric units only:
     1-day plot - ocean current 1-day plot      3-day plot - ocean current 3-day plot      5-day plot - ocean current 5-day plot


Solar Radiation Conditions at 41036 as of
(12:30 pm EDT)
1630 GMT on 05/20/2013:
Unit of Measure:    Time Zone:   

Click on the graph icon in the table below to see a time series plot of the last five days of that observation.

5-day plot - Short Wave Radiation 1Short Wave Radiation 1 (SRAD1): 451.0watts/meter2
Previous observations
5-day plot - Short Wave Radiation 1 5-day plot - Short Wave Radiation 2 5-day plot - Long Wave Radiation
MM   DD    TIME
(EDT)
  SRAD1
w/m2
   SWRAD
w/m2
    LWRAD
w/m2
052012:00 pm 492.0--
052011:30 am 474.0--
052011:00 am 446.0--
052010:30 am 477.0--
052010:00 am 457.0--
05209:30 am 345.0--
05209:00 am 242.0--
05208:30 am 145.0--
05208:00 am 96.0--
05207:30 am 49.0--
05207:00 am 21.0--
05206:30 am 1.0--
05206:00 am 0.0--
05205:30 am 0.0--
05205:00 am 0.0--
05204:30 am 0.0--
05204:00 am 0.0--
05203:30 am 0.0--
05203:00 am 0.0--
05202:30 am 0.0--
05202:00 am 0.0--
05201:30 am 0.0--
05201:00 am 0.0--
052012:30 am 0.0--
052012:00 am 0.0--
051911:30 pm 0.0--
051911:00 pm 0.0--
051910:30 pm 0.0--
051910:00 pm 0.0--
05199:30 pm 0.0--
05199:00 pm 0.0--
05198:30 pm 0.0--
05198:00 pm 6.0--
05197:30 pm 61.0--
05197:00 pm 208.0--
05196:30 pm 276.0--
05196:00 pm 299.0--
05195:30 pm 303.0--
05195:00 pm 349.0--
05194:30 pm 447.0--
05194:00 pm 573.0--
05193:30 pm 632.0--
05193:00 pm 661.0--
05192:30 pm 715.0--
05192:00 pm 686.0--
05191:30 pm 436.0--
05191:00 pm 685.0--

Description of Measurements

Links which are specific to this station are listed below:

Real Time Data in tabular form for the last forty-five days.

Historical Data & Climatic Summaries for quality controlled data for the current month, previous months, and previous years.

The weekly status report and the weekly maintenance report also provide valuable station information.

Note that the payload types and the station locations occasionally change.
Please refer to the NDBC data inventory for the data history of each station.