


![]() View the latest observations near Atlantic Tropical Storm Fernand and East Pacific Tropical Storm Juliette.
View the latest observations near Atlantic Tropical Storm Fernand and East Pacific Tropical Storm Juliette.
Deep-ocean Assessment and Reporting of Tsunamis (DART®)
Brief Overview and Status Report
F. I. González1, H.B. Milburn1, E.N. Bernard1, J. Newman2
1Pacific Marine Environmental Laboratory / NOAA
Seattle, WA 98115
2Joint Institute for the Study of the Atmosphere and Ocean / U. Washington
Seattle, WA 98195
Abstract
As part of the U.S. National Tsunami Hazard Mitigation Program, the DART® Project is an effort by the Pacific Marine Environmental Laboratory of the National Oceanic and Atmospheric Administration to develop a capability for real-time reporting of tsunami measurements in the deep ocean. The systems utilize bottom pressure recorders (BPRs) capable of detecting and measuring tsunamis with amplitude as small as 1 cm in 6000 m of water. The data are transmitted by acoustic modem to a surface buoy, which then relays the information to a ground station via satellite telecommunications. This concept has been proven through several deep ocean deployments of prototype systems that provided extended periods of excellent data return. Design improvements in the next generation of systems will reduce the high data losses experienced during other periods. A planned network of six buoys in the north Pacific and equatorial region focuses on the hazard to U.S. coastal communities. Once this technology matures, consideration should be given to a coordinated international effort to establish additional stations of direct benefit to other Pacific Rim countries.
Background and Motivation
DART® is a component of the larger U.S. National Tsunami Hazard Mitigation Program. The NTHMP is a comprehensive, joint Federal/State effort to reduce the loss of life and property due to tsunami inundation of U.S. coastlines. Cooperating U.S. agencies include NOAA, the Federal Emergency Management Agency, the U.S. Geological Survey and the Emergency Management agencies of the five Pacific States: Alaska, California, Hawaii, Oregon and Washington (Bernard, 1997; Hagemeyer, 1998).
Early in the NTHMP development process, all five states identified a primary concern -- the need to develop a capability that would both quickly confirm the existence of potentially destructive tsunamis and would also reduce the incidence of false alarms. At present, U.S. coastal communities receive warnings based on shore-based seismic and coastal sea level stations. Unfortunately, an unacceptable 75% false alarm rate has prevailed since the 1950's (Yanagi, 1996). These false alarms are expensive, undermine the credibility of the warning system, and place citizens at physical risk of accidental injury or death during the evacuation.
Motivation for the DART® Project is straightforward. Seismic data and coastal sea level data continue to be essential to the tsunami warning system. However, these data suffer from inherent and obvious limitations. They are simply that (1) seismometers do not measure tsunamis, i.e., seismometer-based assessments are inherently inferential, and not based on a direct measurement of the phenomena posing the hazard, and (2) coastal sea level stations do not provide a direct measurement of deep ocean tsunami energy propagating toward a far-field community.
Clearly, the hazard assessment process and the speed and accuracy of warnings would be improved by direct measurement and real-time reporting of tsunami energy at deep ocean stations offshore of the generation region. In addition, continued offshore tsunami monitoring will provide important guidance to emergency managers charged with the decision to sound the "all-clear" and declare the area safe for the deployment of personnel and equipment into a disaster area for rescue and recovery operations. Dangerous conditions can persist for several hours, since very large tsunamis can have periods as long as an hour and the largest wave may arrive as late as the third or fourth in a series. Conceptually, the idea of a real-time reporting network is straightforward (Zielinski and Saxena, 1983); however, formidable technological and logistical challenges have discouraged implementation until now.
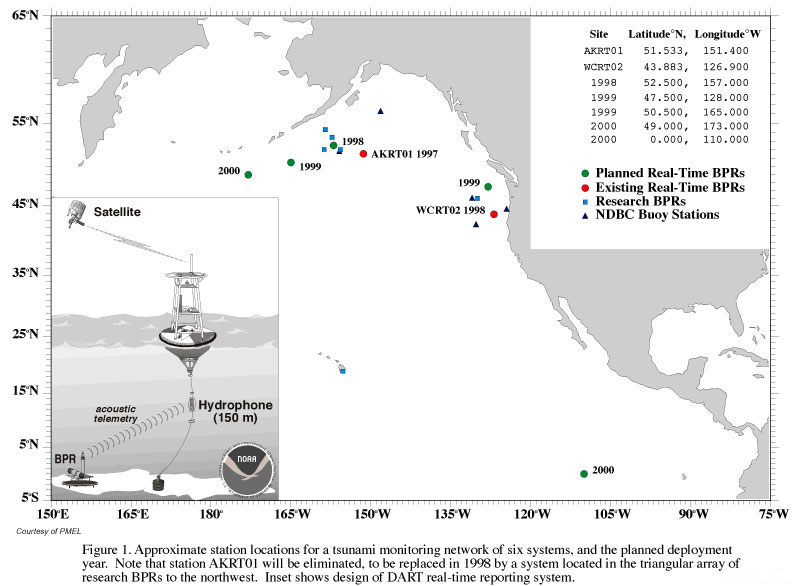
Briefly stated, the PMEL DART® Project seeks to design, fabricate, test, deploy, and maintain a reliable deep ocean network (Figure 1) of six real-time reporting tsunami measurement systems to provide early detection and direct measurement of tsunamis generated in those source regions that pose the most direct threat to U.S. coastal communities: the Alaska-Aleutian Subduction Zone (AASZ), the Cascadia Subduction Zone (CSZ), and the South American Seismic Zone (SASZ). The DART® Project is the first attempt to implement this ambitious concept.
System Design and Testing
The real-time reporting system (Figure 1) consists of a bottom pressure recorder (BPR) that resides on the ocean floor and utilizes an acoustic modem operating at 15-18 kHz to transmit data to a surface buoy, which then relays the information to shore through a satellite telecommunications link (Milburn, et al., 1996). The system design must meet two fundamental technological challenges: first, the deep-ocean buoy mooring must survive the hostile environment of the North Pacific; second, the deep ocean-to-surface acoustic data link must perform with high reliability in the hostile ocean environment.
There are two data reporting modes:
(a) Scheduled Transmission. Each hour, five numerical values are relayed via NOAA's Geostationary Operational Environmental Satellite (GOES) -- four 15-min average values of sea level and a system engineering status indicator.
(b) Triggered Transmission. If a tsunami is detected, waveform data are transmitted immediately (< 3 minute delay) via the GOES "random-mode" channels. Initially, the data are 15-sec values, but the sampling rate gradually increases to 1-minute values. The tsunami detection algorithm predicts the next value of each 15-sec measurement by a Newton cubic extrapolation of previous observations, and is triggered when measured and predicted values differ by more than the 3 cm threshold (H.O. Mofjeld, unpublished notes. Tsunami waveform data continue to be transmitted until a continuous 4-hr period has been completed without triggering the tsunami detection algorithm; i.e., data are reported until the estimated tsunami amplitude is less than 3 cm during a complete 4-hour period. At this point the system returns to the Scheduled Transmission reporting mode.
A prototype system was deployed off the Washington-Oregon coast in 2600 m of water for a period of almost 2 months in the summer of 1995. The surface buoy performed well, even during periods when significant wave height exceeded 6 m. However, data losses of approximately 5% were experienced and, surprisingly, these appeared to be uncorrelated with high wind or significant wave height. This test in intermediate ocean depth was then followed by deep ocean tests off Oahu, Hawaii in March, 1997; the objective was to improve the design and further reduce data loss by quantifying the acoustic beam pattern, signal-to-noise levels, acoustic modem baffle performance, and mooring and hardware design parameters. This deep water test was successful, design details were refined accordingly, and two demonstration systems were fabricated and tested.
System Deployments
The first demonstration system was deployed south of the Shumagin Islands, Alaska (station AKRT01) in 4600 meters of water in July 1997. Shipboard monitoring indicated data were transmitted acoustically from the BPR to the surface but no data were transmitted to shore due to buoy electronic failures that were later traced to software and battery problems. Severe weather conditions prevented any additional work with the buoy at that time. In mid-September, 1997, a second system was successfully deployed off the Washington-Oregon coast (WCRT02) in 2700 meters of water. In October, 1997, the Alaska buoy (AKRT01) was recovered, repaired at sea, and redeployed with the system fully functional; but transmissions ceased in early December, due to failure of the on-board electronics for the GOES link. The West Coast system was recovered in February, 1998.
Data Dropout Problem
The time series records of sea level acquired in real time by scheduled transmissions from both stations are presented in Figure 2. Also shown are the significant wave height and wind data acquired from a nearby NOAA environmental buoy, and rain rates generated at NOAA/NESDIS using the special sensor microwave imager (SSM/I) of the Defense Meteorological Satellite Program (DMSP).
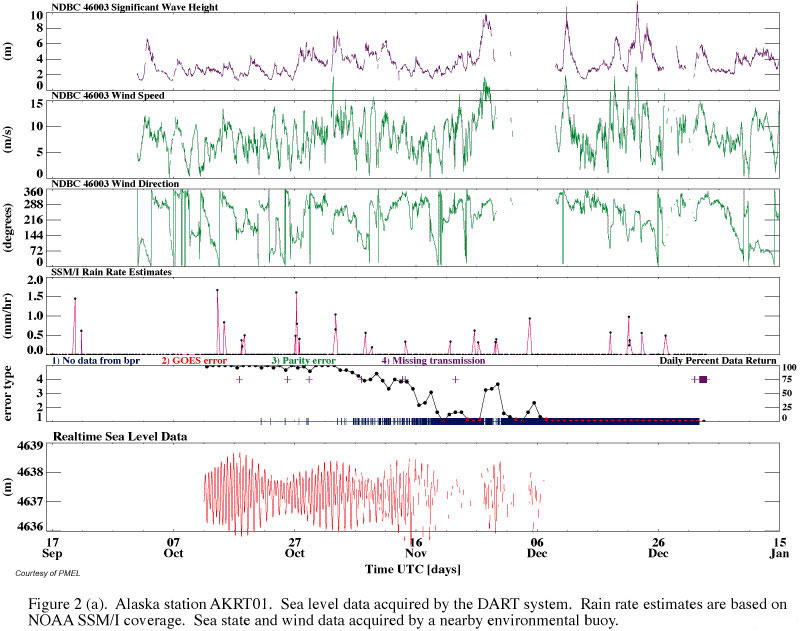
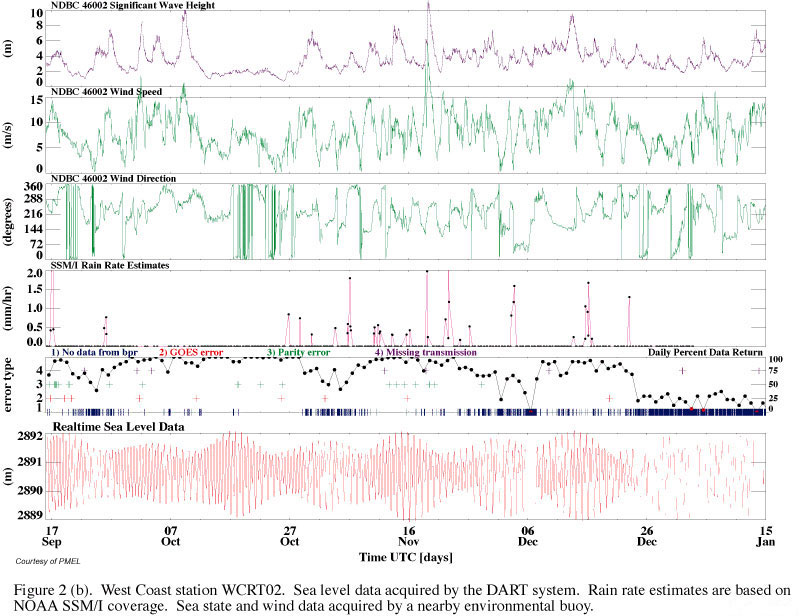
We see that data losses at both stations are unexpectedly high. The AKRT01 record is too short to reveal any patterns in the data dropout rates before the eventual cessation of data transmissions due to failure of the onboard GOES link. The WCRT02 record, however, clearly reveals temporal variations in the Daily Percent Data Return (DPDR ) characterized by time scales of tens of days. In particular, during the 194-day period from 16 September to 24 December, the DPDR for WCRT02 is characterized by three well-defined "data dropout events," each lasting about 10 days from onset of data losses to recovery. These events do not appear to be correlated with any of the environmental parameters shown. Finally, we note that the end of this record is characterized by a lengthy period of data return that is consistently less than 50%; this qualitatively different failure mode suggests a different failure mechanism than that responsible for the three distinct events.
To investigate the possibility of transmission shadowing due to the relative positions of the BPR and surface buoy, we also computed estimates (not shown) of the distance and bearing from the BPR to the surface buoy from buoy position data available through the GOES system. We found no correlation in data dropouts with these relative position data.
Other candidate causes of the data dropout problem include: (a) Damage to the cable connecting the transducer to the buoy. Damage was, in fact, observed on recovery of system WCRT02; the cable was severed, but manipulation of the cable in the lab did cause contact to be restored intermittently. However, this may not explain the three WCRT02 data dropout events. The time of the damage is unknown, so it may have occurred anytime, including the last few weeks of the deployment, or even during recovery operations. It is also difficult to accept that this type of damage could produce the temporal patterns observed in the data dropout records -- i.e., relatively long periods of both high and low data return rates. (b) Acoustic interference by ship noise. This is unlikely, because ship noise disruptions would be relatively short-lived, and would not result in data dropout time scales of tens of days. (c) Acoustic interference from biological noise. Also unlikely, since bio-noise frequencies are well below the modem frequency range. (d) Signal degradation by lowering of the thermocline below 95 m. This is possible but unlikely; theory predicts very little reflection from the thermocline at the range of incident angles characterizing the system. (e) Acoustic interference by rain noise. This is a possibility, since recently published measurements indicate that the rain noise spectrum is characterized by a broad peak encompassing the modem operating frequency (Black, et al., 1997).
Unfortunately, neither thermocline depth, rain rates, or total background noise levels are currently monitored at either station. However, rain rate estimates can be computed from SSM/I data. In addition, wave and wind data were collected by three NOAA data buoys in the region of interest (Figure 1). Coastal data buoy 46050 is located 210 km northeast of station WCRT02, while the offshore buoys 46005 and 46002 are located approximately 410 km northwest and 310 km southwest of the station, respectively. A comparison of data from all three buoys revealed strikingly similar time series; we therefore selected the observations collected at the nearest open ocean buoy, 46002, as most likely to be representative of the open ocean conditions at WCRT02. Figure 3 summarizes the simple analyses we performed of this rather limited database of WCRT02 data dropout rates and the rain, wave and wind estimates..
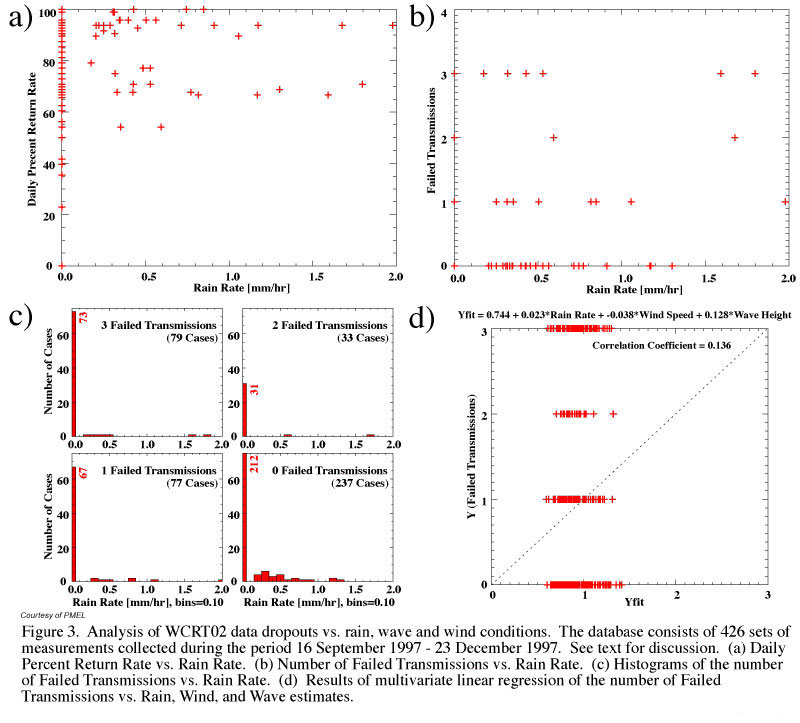
Figure 3(a) presents a simple pairing of every rain rate estimate available with the daily return rate for that day. The resulting scatter plot fails to reveal a strong correlation of daily return rate with rain rate. Note, however, that more than one rain rate estimate per day is usually available, so that the same daily data return rate can be paired with multiple rain rates which can be substantially different; the simple pairing approach was taken because the episodic nature of the rain (Figure 2b) precludes averaging. Because rain is episodic, finer temporal resolution of system performance is desirable. This is provided by the hourly record of Failed Transmissions; each hour, three attempts are made to acoustically transmit data from the ocean bottom unit to the surface buoy, and a record is kept of the number of failed attempts during each hourly cycle. If there are zero failed transmissions, this indicates that transmission and reception of data was successful on the first attempt; three failed transmissions indicate a total failure to receive any data that hour.
Figure 3(b) presents a pairing of each rain rate estimate with the number of failed transmissions for that hour. Again, no correlation is obvious. It is important to note that there are a total of 462 data points, but the vast majority of data pairs correspond to a zero rain rate estimate, and these are not distinguishable in this presentation.
Figure 3(c) clarifies this point through histograms of the number of failed transmissions, binned by 0.1 mm/hr rain rate increments. Two important features of this presentation should be noted. First, there were 73 cases of total data dropout, i.e. 3 Failed Transmissions, even in the absence of rain. Second, 87% (i.e., 37 of 43) of the attempts to transmit data in the presence of rain were ultimately successful (i.e., 0, 1, or 2 Failed Transmissions). These three simple analyses of rain data suggest that factors other than rain may be responsible for the data dropouts.
Figure 3(d) presents the results of a multivariate linear regression of Failed Transmissions, Y, to rain rate, wind speed and wave height. Wind speed and wave height are introduced into the analysis because these can generate additional background acoustic noise of their own, as well as modify the amplitude of the rain noise. Note the "perfect fit" line, the large scatter, and the small correlation coefficient. Regressions (not shown) were also attempted of Failed Transmissions with combinations of only two of the three environmental parameters (rain, wind), (rain, waves), (wind, waves), as well as wind alone and wave height alone, but similarly uncorrelated results were obtained.
It is important to note the limitations of this dataset. The spatial resolution of an SSM/I rain rate estimate is approximately 30 km x 40 km; furthermore, the temporal resolution is about 2 or 3 observations per day, so that some periods of rain could easily have been missed. The wind and wave measurements appear to be representative of conditions at WCRT02; still, it must be kept in mind that they were acquired approximately 300 km distant from that site. Finally, it must be kept in mind that these estimates provide only inferred, not directly measured, background noise level. Because of these limitations, the possibility that these environmental parameters are responsible either directly or indirectly (as a source of noise) for data dropouts cannot be ruled out. Nonetheless, the data strongly suggest that neither rain rate, wind speed or wave height are responsible for the observed WCRT02 data dropouts.
Similarly, there is no obvious correlation of the DPDR time series with either wind direction (Figure 2b) or average wave period (not shown). However, histogram analyses reveal apparent biases in total transmission failure; failures seem to occur more often with offshore wind direction (Figure 4a) or with longer average wave period (Figure 4b). Note that these histograms represent the percentage of failures in each 30-degree bin, not the absolute number of cases; this normalizing procedure accounts for variation in the number of cases observed for each directional bin. The two histograms suggest that a high percentage of failures may occur during confused, bi-modal seas created when open ocean swell encounter short period waves generated by offshore winds under limited fetch conditions. This hypothesis is not borne out, however, on further examination. Swell and offshore wind do not necessarily occur simultaneously, and regression analyses (not shown) indicate that there is no correlation between the number of failed transmissions and the wind direction and wave period. Furthermore, wave spectral data do not reveal any strongly bi-modal sea state events during the three data dropout periods (Figures 4e, 4f).
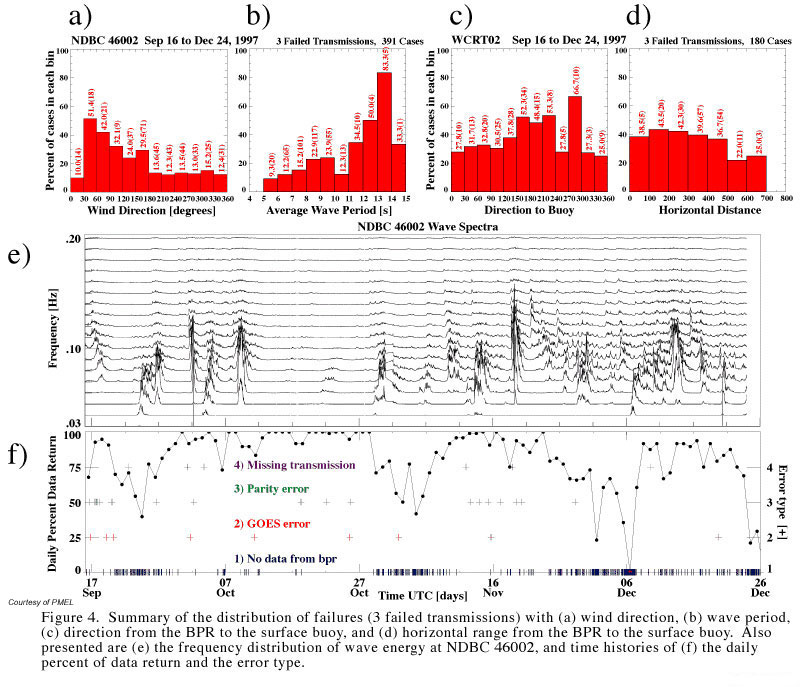
Histograms of the BPR-to-buoy bearing (Figure 4c) and distance (Figure 4d) were constructed to investigate the possibility that the relative positions of the BPR and surface buoy may affect the success rate of acoustic transmissions. The results do suggest that a larger percentage of failures occur when the buoy is in a southerly sector from 120--240 deg relative to the BPR or a westerly sector from 270-300 deg. Acoustic shadowing by bathymetric features, is possible. However, this is unlikely; the depth of 2700 m and maximum horizontal distance of 700 m means that the angle from the BPR to the surface buoy is always less than 15 deg off the vertical, and the bathymetry is relatively flat at the site. Another possibility is acoustic shadowing by a package of flotation spheres located approximately 10 m above the acoustic transmitter on the sea floor. Drift of this package in and out of the bottom-to-surface transmission path could occur on time scales characteristic of mesoscale surface current and wind variations that determine the position of the surface buoy and receiver. Again, the geometry suggests this is an improbable source of extended periods of dropout. The scope of the mooring is a circle with 1400 m radius at the surface, while the corresponding radius of the potential shadow zone is only 112.5 m; the area of the shadow zone circle is thus only about 0.65% of the area of the mooring scope.
Future Plans
We are improving the present system design to address each of the potential causes of data that we have discussed here. A second-generation modem will be used that operates between 8 and 12 kHz, farther from the rain noise peak, and incorporates a more robust acoustic encoding scheme (Scussel, et al., 1997). This modem will also provide rough estimates of the acoustic interference level at the time of transmission. Acoustic baffling will be improved, including material on the transducer top cap to block acoustic energy emanating from the ocean surface. The transducer cable will be eliminated by introducing inductive coupling to link the modem and transducer with the surface buoy, and the transducer depth will be increased to 150 m. The flotation tether will be lengthened to 50m, reducing the potential area of the acoustic shadow at the surface to about 50 m, or only 0.1% of the mooring scope area. If possible, the next deployment of these systems will also include direct measurement of total background noise level in the frequency band of the acoustic transmissions.
If field tests are successful, then the existing systems will be replaced during the 1998 summer field season. If these deployments provide reliable data return, then the long-term plan is to establish two additional stations in 1999 and complete the 6-station network with the final two deployments in the year 2000 (Figure 1).
Summary
A deep ocean, early detection and real-time reporting tsunami monitoring network is planned. Six stations, sited near potential generation zones, are expected to be established by the year 2000. In the last year, two DART® systems have been designed, fabricated, tested, and deployed in the North Pacific. Physical survivability and reliable data return are the primary technological challenges. The systems have survived well, and successfully transmitted real-time data in seas with significant wave heights that exceed 10 m. Each deployed system has provided extended periods of excellent data return, thus proving the feasibility of the concept. However, periods of unexplained data loss rates have been experienced, and reliable data return has not yet been achieved. Improvements to achieve reliable data return will be incorporated into two more systems currently being fabricated, and these will replace the existing systems in the summer of 1998.
This U.S. research and development effort is focused on the hazard to U.S. coastal communities. However, the planned station between Hawaii and tsunami sources off South America will also benefit countries in the western Pacific that are threatened by such tsunamis. Once this technology matures, consideration should be given to a coordinated international effort to establish additional stations. For example, additional South American stations would improve coverage of that source region, and stations off Kamchatka and in the eastern Sea of Japan would benefit Japan, Korea and Russia.
Acknowledgments
DART® work is supported by the U.S. National Tsunami Hazard Mitigation Program. In addition, the Defense Advanced Research Projects Agency of the Department of Defense provided funding to fabricate, test, and deploy one of the two demonstration systems in FY97. The SSM/I rain rate estimates were kindly provided by Dr. Paul Chang, Office of Research and Applications, NOAA National Environmental Satellite, Data, and Information Service. The wind and wave data were provided by the NOAA National Data Buoy Center. This report is PMEL contribution 1949 and JISAO contribution 507.
References
Bernard, E.N. (1997): Reducing tsunami hazards along U.S. coastlines. In Perspectives on
Tsunami Hazard Reduction, Proceedings of the 1995 IUGG Tsunami Symposium, Kluwer
Academic Publishers, 189-203.
Black, P.G., J.R. Proni, J.C. Wilkerson, C.E. Samsbury (1997): Oceanic Rainfall Detection and
Classification in Tropical and Subtropical Mesoscale Convective Systems Using Underwater
Acoustic Methods, Monthly Weather Review, 125, 2014-2042.
Hagemeyer, R., 1998: Tsunami hazard mitigation in U.S., these Proceedings.
Milburn, H.B., A.I. Nakamura, and F.I. González (1996): Real-time tsunami reporting from the
deep ocean. In Proceedings of the Oceans 96 MTS/IEEE Conference, 23-26 September 1996,
Fort Lauderdale, FL, 390-394.
Scussel, K.F., J.A. Rice and S. Merriam (1997): A New MFSK Acoustic Modem for Operation
in Adverse Underwater Channels. In Proceedings of the OCEANS 96 MTS/IEEE Conference,
6-9 October 1997, Halifax, Nova Scotia.
Yanagi, B.S. (1996): Tsunami Preparedness in Hawaii. In Coastal Earthquakes and Tsunamis:
Reducing the Risks, J.W. Charland and J.W. Good, Eds., Corvallis, OR, Oregon Sea Grant.
Zielinski, A. and N. Saxena (1983): Rationale for Measurement of Midocean Tsunami Signature,
Marine Geodesy, 6, 331-337.
Back to DART® Prototype Test Deployment Page