


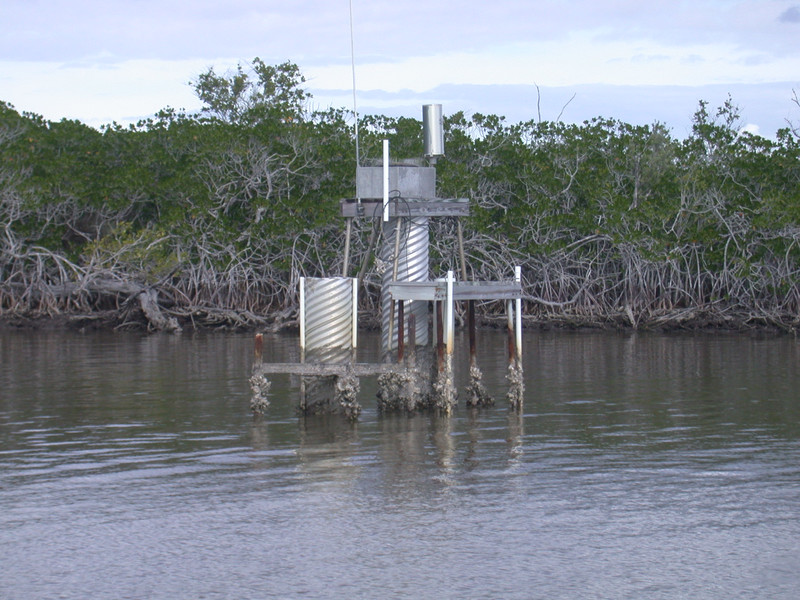
Station WWEF1 - Whitewater Bay-East, FL 
Owned and maintained by Everglades National Park
Water Quality Station
25.232 N 80.938 W (25°13'54" N 80°56'18" W)
Site elevation: sea level
Sea temp depth: 1.5 m below MLLW
(24 hours for tsunami stations)
|
Click on the graph icon in the table below to see a time series plot of the last five days of that observation. | |
| 12.8 m | |
| 27.5 °C | |
| 8.39 psu | |
| 0.86 m | |
| TIME (GMT) |
WDIR |
WSPD m/s |
GST m/s |
WVHT m |
DPD sec |
APD sec |
MWD |
PRES mb |
PTDY mb |
ATMP °C |
WTMP °C |
DEWP °C |
SAL psu |
VIS km |
TIDE m |
|---|---|---|---|---|---|---|---|---|---|---|---|---|---|---|---|
| 2024-04-25 1900 | - | - | - | 12.8 | - | - | - | - | - | - | 27.1 | - | 8.41 | - | 0.86 |
| 2024-04-25 1800 | - | - | - | 12.8 | - | - | - | - | - | - | 26.7 | - | 8.41 | - | 0.86 |
| 2024-04-25 1700 | - | - | - | 12.8 | - | - | - | - | - | - | 26.3 | - | 8.42 | - | 0.86 |
| 2024-04-25 1600 | - | - | - | 12.8 | - | - | - | - | - | - | 26.0 | - | 8.46 | - | 0.86 |
| 2024-04-25 1500 | - | - | - | 12.8 | - | - | - | - | - | - | 25.9 | - | 8.49 | - | 0.86 |
| 2024-04-25 1400 | - | - | - | 12.8 | - | - | - | - | - | - | 25.6 | - | 8.32 | - | 0.86 |
|
These oceanographic data are displayed in rounded times. Click on the graph icon in the table below to see a time series plot of the last five days of that observation. | |
| Depth (DEPTH): | 1.5 m |
| 27.49 °C | |
| 8.39 psu | |
| TIME (GMT) |
DEPTH m |
OTMP °C |
COND mS/cm |
SAL psu |
O2% % |
O2PPM ppm |
CLCON ug/l |
TURB FTU |
PH |
EH mv |
|---|---|---|---|---|---|---|---|---|---|---|
| 2024-04-25 1900 | 1.5 | 27.06 | - | 8.41 | - | - | - | - | - | - |
| 2024-04-25 1800 | 1.5 | 26.70 | - | 8.41 | - | - | - | - | - | - |
| 2024-04-25 1700 | 1.5 | 26.28 | - | 8.42 | - | - | - | - | - | - |
| 2024-04-25 1600 | 1.5 | 26.03 | - | 8.46 | - | - | - | - | - | - |
| 2024-04-25 1500 | 1.5 | 25.90 | - | 8.49 | - | - | - | - | - | - |
| 2024-04-25 1400 | 1.5 | 25.58 | - | 8.32 | - | - | - | - | - | - |
|
Click on the graph icon in the table below to see a time series plot of the last five days of that observation. | ||
* indicates interpolated rain values | ||
| -------- Ten-minute Rain Rates (Centered at hour + minutes) --------- | ||||||||||||||
|---|---|---|---|---|---|---|---|---|---|---|---|---|---|---|
| TIME (GMT) |
Hourly Accum mm |
0 mm/hour | 10 mm/hour | 20 mm/hour | 30 mm/hour | 40 mm/hour | 50 mm/hour | |||||||
| 2024-04-25 2000 | 0.0 | - | - | - | - | - | - | |||||||
| 2024-04-25 1900 | 0.0 | - | - | - | - | - | - | |||||||
| 2024-04-25 1800 | 0.0 | - | - | - | - | - | - | |||||||
| 2024-04-25 1700 | 0.0 | - | - | - | - | - | - | |||||||
| 2024-04-25 1600 | 0.0 | - | - | - | - | - | - | |||||||
| 2024-04-25 1500 | 0.0 | - | - | - | - | - | - | |||||||
| 2024-04-25 1400 | 0.0 | - | - | - | - | - | - | |||||||
Links which are specific to this station are listed below:
Real Time Data in tabular form for the last forty-five days.
Historical data for this station can be requested by directly contacting the Everglades NPS at email: EVER_data_request@nps.gov