


Station LBRF1 - Broad River Lower, FL
Owned and maintained by Everglades National Park
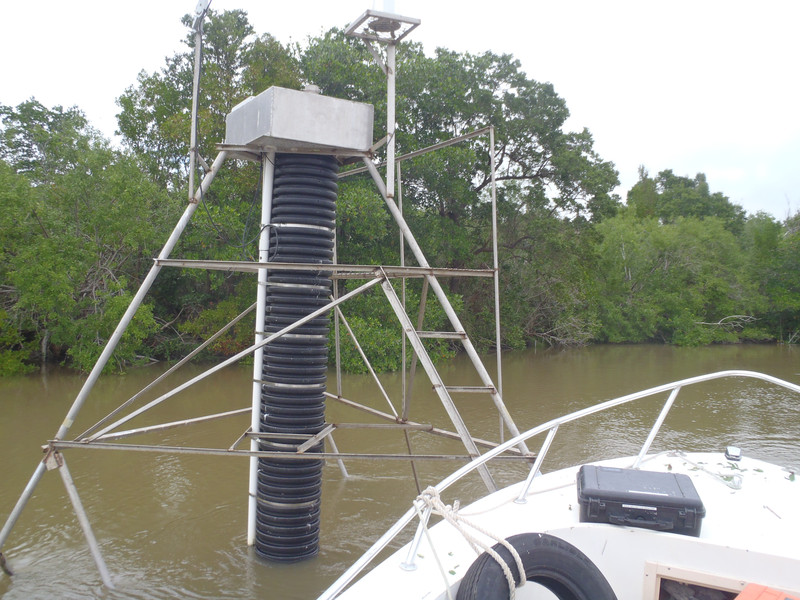
Water Quality Station
25.484 N 81.133 W (25°29'4" N 81°8'0" W)
Site elevation: sea level
Sea temp depth: 1.5 m below MLLW
Water levels are referenced to local datums. They provide relative change in water level and are not to be used for navigation.
Large icon indicates selected station.
 Stations with recent data
 Stations with no data in last 8 hours
(24 hours for tsunami stations)
(24 hours for tsunami stations)
No Recent Reports
Links which are specific to this station are listed below:
Data for last 45 days: No data available.
- Historical data (data descriptions)
- Search historical meteorological data for observations that meet your threshold conditions
Some data files have been compressed with the GNU gzip program.