


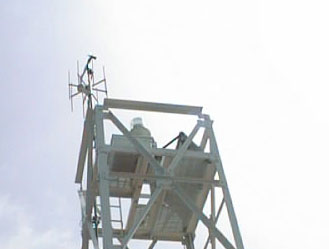
Station CHII2 - Harrison-Dever Crib, Chicago, IL 
Owned and maintained by Great Lakes Environmental Research Laboratory
C-MAN Station
41.916 N 87.572 W (41°54'58" N 87°34'20" W)
Site elevation: 176 m above mean sea level
Air temp height: 22.9 m above site elevation
Anemometer height: 25.9 m above site elevation
Large icon indicates selected station.
 Stations with recent data
 Stations with no data in last 8 hours
(24 hours for tsunami stations)
(24 hours for tsunami stations)
|
Click on the graph icon in the table below to see a time series plot of the last five days of that observation. | |
| WNW ( 290 deg true ) | |
| 22 kts | |
| 27 kts | |
| 50.4 °F | |
| 23.4 °F | |
| 43.2 °F | |
| TIME (CDT) |
WDIR |
WSPD kts |
GST kts |
WVHT ft |
DPD sec |
APD sec |
MWD |
PRES in |
PTDY in |
ATMP °F |
WTMP °F |
DEWP °F |
SAL psu |
VIS nmi |
TIDE ft |
|---|---|---|---|---|---|---|---|---|---|---|---|---|---|---|---|
| 2024-04-19 11:10 am | WNW | 18 | 23 | - | - | - | - | - | - | 50.2 | - | 27.5 | - | - | - |
| 2024-04-19 11:00 am | WNW | 24 | 26 | - | - | - | - | - | - | 50.0 | - | 24.6 | - | - | - |
| 2024-04-19 10:50 am | WNW | 26 | 31 | - | - | - | - | - | - | 49.6 | - | 22.3 | - | - | - |
| 2024-04-19 10:40 am | WNW | 26 | 28 | - | - | - | - | - | - | 49.5 | - | 23.7 | - | - | - |
| 2024-04-19 10:20 am | WNW | 31 | 35 | - | - | - | - | - | - | 49.1 | - | 22.6 | - | - | - |
| 2024-04-19 10:10 am | WNW | 21 | 24 | - | - | - | - | - | - | 49.1 | - | 22.3 | - | - | - |
| 2024-04-19 10:00 am | WNW | 27 | 30 | - | - | - | - | - | - | 48.9 | - | 21.9 | - | - | - |
| 2024-04-19 09:50 am | NW | 23 | 26 | - | - | - | - | - | - | 48.6 | - | 21.7 | - | - | - |
| 2024-04-19 09:40 am | WNW | 22 | 25 | - | - | - | - | - | - | 48.6 | - | 25.2 | - | - | - |
| 2024-04-19 09:30 am | WNW | 26 | 31 | - | - | - | - | - | - | 48.2 | - | 23.5 | - | - | - |
| 2024-04-19 09:20 am | WNW | 23 | 25 | - | - | - | - | - | - | 47.7 | - | 23.4 | - | - | - |
| 2024-04-19 09:10 am | WNW | 24 | 28 | - | - | - | - | - | - | 47.5 | - | 25.7 | - | - | - |
| 2024-04-19 08:00 am | NW | 16 | 19 | - | - | - | - | - | - | 46.4 | - | 31.1 | - | - | - |
| 2024-04-19 06:00 am | NW | 23 | 26 | - | - | - | - | - | - | 46.8 | - | 36.0 | - | - | - |
| 2024-04-19 05:30 am | NW | 24 | 27 | - | - | - | - | - | - | 47.3 | - | 37.4 | - | - | - |
| 2024-04-19 04:00 am | NNW | 28 | 30 | - | - | - | - | - | - | 50.2 | - | 39.4 | - | - | - |
| 2024-04-19 02:50 am | NNW | 23 | 24 | - | - | - | - | - | - | 52.2 | - | 46.2 | - | - | - |
| 2024-04-19 02:40 am | NW | 20 | 22 | - | - | - | - | - | - | 52.5 | - | 46.6 | - | - | - |
| 2024-04-19 02:00 am | NW | 15 | 17 | - | - | - | - | - | - | 51.6 | - | 50.9 | - | - | - |
| 2024-04-19 01:50 am | NNW | 11 | 12 | - | - | - | - | - | - | 50.7 | - | 50.7 | - | - | - |
| 2024-04-19 01:40 am | NNW | 9 | 10 | - | - | - | - | - | - | 49.6 | - | 49.6 | - | - | - |
| 2024-04-19 12:20 am | N | 8 | 10 | - | - | - | - | - | - | 48.9 | - | 48.0 | - | - | - |
| 2024-04-18 11:50 pm | N | 10 | 11 | - | - | - | - | - | - | 48.0 | - | 47.7 | - | - | - |
| 2024-04-18 11:40 pm | N | 12 | 13 | - | - | - | - | - | - | 47.8 | - | 47.8 | - | - | - |
| 2024-04-18 11:20 pm | N | 14 | 15 | - | - | - | - | - | - | 48.4 | - | 46.6 | - | - | - |
| 2024-04-18 11:10 pm | N | 15 | 15 | - | - | - | - | - | - | 48.4 | - | 46.8 | - | - | - |
| 2024-04-18 10:20 pm | N | 12 | 13 | - | - | - | - | - | - | 48.4 | - | 47.3 | - | - | - |
| 2024-04-18 10:10 pm | N | 13 | 14 | - | - | - | - | - | - | 48.2 | - | 47.3 | - | - | - |
| 2024-04-18 10:00 pm | NNE | 11 | 12 | - | - | - | - | - | - | 48.4 | - | 47.1 | - | - | - |
| 2024-04-18 08:30 pm | N | 15 | 17 | - | - | - | - | - | - | 49.1 | - | 48.2 | - | - | - |
| 2024-04-18 08:20 pm | N | 16 | 18 | - | - | - | - | - | - | 48.7 | - | 48.4 | - | - | - |
| 2024-04-18 08:10 pm | N | 17 | 18 | - | - | - | - | - | - | 48.7 | - | 48.4 | - | - | - |
| 2024-04-18 08:00 pm | N | 17 | 19 | - | - | - | - | - | - | 48.7 | - | 48.7 | - | - | - |
| 2024-04-18 07:20 pm | N | 14 | 16 | - | - | - | - | - | - | 50.4 | - | 49.5 | - | - | - |
| 2024-04-18 07:10 pm | N | 15 | 16 | - | - | - | - | - | - | 50.4 | - | 49.6 | - | - | - |
| 2024-04-18 06:20 pm | N | 10 | 11 | - | - | - | - | - | - | 51.1 | - | 48.4 | - | - | - |
| 2024-04-18 06:10 pm | N | 11 | 11 | - | - | - | - | - | - | 50.9 | - | 48.0 | - | - | - |
| 2024-04-18 05:20 pm | N | 9 | 10 | - | - | - | - | - | - | 50.9 | - | 48.0 | - | - | - |
| 2024-04-18 05:10 pm | N | 10 | 11 | - | - | - | - | - | - | 51.1 | - | 48.0 | - | - | - |
| 2024-04-18 05:00 pm | N | 10 | 10 | - | - | - | - | - | - | 51.3 | - | 47.7 | - | - | - |
| 2024-04-18 04:50 pm | N | 9 | 10 | - | - | - | - | - | - | 50.7 | - | 47.1 | - | - | - |
| 2024-04-18 04:40 pm | N | 9 | 10 | - | - | - | - | - | - | 50.7 | - | 47.5 | - | - | - |
| 2024-04-18 04:20 pm | NNE | 11 | 12 | - | - | - | - | - | - | 50.9 | - | 46.9 | - | - | - |
| 2024-04-18 04:10 pm | NNE | 9 | 9 | - | - | - | - | - | - | 51.1 | - | 46.8 | - | - | - |
| 2024-04-18 02:50 pm | E | 8 | 10 | - | - | - | - | - | - | 51.6 | - | 46.6 | - | - | - |
| 2024-04-18 02:40 pm | E | 9 | 11 | - | - | - | - | - | - | 51.4 | - | 46.8 | - | - | - |
| 2024-04-18 02:20 pm | E | 11 | 12 | - | - | - | - | - | - | 50.9 | - | 47.3 | - | - | - |
| 2024-04-18 02:10 pm | ESE | 12 | 13 | - | - | - | - | - | - | 51.4 | - | 47.7 | - | - | - |
| 2024-04-18 02:00 pm | ESE | 11 | 12 | - | - | - | - | - | - | 52.3 | - | 48.0 | - | - | - |
| 2024-04-18 01:50 pm | ESE | 7 | 9 | - | - | - | - | - | - | 52.5 | - | 48.7 | - | - | - |
| 2024-04-18 01:40 pm | SE | 8 | 8 | - | - | - | - | - | - | 52.5 | - | 48.7 | - | - | - |
| 2024-04-18 01:30 pm | SE | 5 | 6 | - | - | - | - | - | - | 52.3 | - | 48.9 | - | - | - |
| 2024-04-18 01:00 pm | SE | 8 | 9 | - | - | - | - | - | - | 52.9 | - | 48.9 | - | - | - |
| 2024-04-18 12:30 pm | E | 13 | 14 | - | - | - | - | - | - | 53.6 | - | 46.8 | - | - | - |
| 2024-04-18 12:00 pm | ENE | 7 | 8 | - | - | - | - | - | - | 55.2 | - | 46.0 | - | - | - |
Links which are specific to this station are listed below:
Real Time Data in tabular form for the last forty-five days.
Historical Data & Climatic Summaries for quality controlled data for prior months and years.