


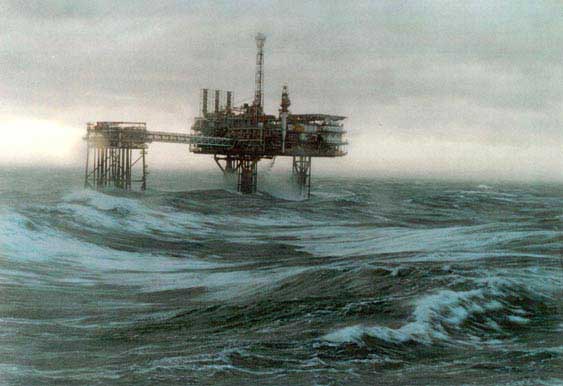
Station 63110 - Beryl A AWS 
Owned and maintained by Private Industry
Oil Platform
59.500 N 1.500 E (59°30'0" N 1°30'0" E)
Large icon indicates selected station.
 Stations with recent data
 Stations with no data in last 8 hours
(24 hours for tsunami stations)
(24 hours for tsunami stations)
Data from this station are not quality controlled by NDBC
|
Click on the graph icon in the table below to see a time series plot of the last 24 hours of that observation. | |
| SE ( 130 deg true ) | |
| 26.0 kts | |
| 9.2 ft | |
| 29.44 in | |
| -0.08 in ( Falling ) | |
| 49.3 °F | |
| 48.2 °F | |
| 2.0 nmi | |
| 41.0 °F | |
Data from this station are not quality controlled by NDBC
| TIME (GMT) |
WDIR |
WSPD kts |
GST kts |
WVHT ft |
DPD sec |
APD sec |
MWD |
PRES in |
PTDY in |
ATMP °F |
WTMP °F |
DEWP °F |
SAL psu |
VIS nmi |
TIDE ft |
|---|---|---|---|---|---|---|---|---|---|---|---|---|---|---|---|
| 2024-04-29 0000 | SE | 25.1 | - | 9.8 | - | - | - | 29.47 | -0.06 | 50.0 | - | 48.9 | - | 2.0 | - |
| 2024-04-28 2300 | SE | 26.0 | - | 9.5 | - | - | - | 29.49 | -0.04 | 50.0 | - | 48.9 | - | 1.0 | - |
| 2024-04-28 2200 | SE | 28.9 | - | 8.5 | - | - | - | 29.52 | -0.02 | 49.8 | - | 48.9 | - | 2.0 | - |
| 2024-04-28 2100 | SE | 28.0 | - | 7.5 | - | - | - | 29.52 | -0.00 | 49.8 | - | 48.9 | - | 2.0 | - |
| 2024-04-28 2000 | SE | 28.0 | - | 6.9 | - | - | - | 29.53 | -0.04 | 49.8 | - | 48.9 | - | 2.0 | - |
| 2024-04-28 1900 | SE | 25.1 | - | 6.9 | - | - | - | 29.54 | -0.10 | 50.0 | - | 48.6 | - | 2.0 | - |
| 2024-04-28 1800 | ENE | 15.0 | - | 6.6 | - | - | - | 29.53 | -0.13 | 48.7 | - | 47.1 | - | 1.0 | - |
| 2024-04-28 1700 | ENE | 15.9 | - | 6.2 | - | - | - | 29.58 | -0.13 | 47.7 | - | 45.1 | - | 1.0 | - |
| 2024-04-28 1600 | NE | 14.0 | - | 5.6 | - | - | - | 29.64 | -0.10 | 47.3 | - | 43.3 | - | 1.0 | - |
| 2024-04-28 1500 | NE | 14.0 | - | 5.2 | - | - | - | 29.66 | -0.10 | 46.6 | - | 42.1 | - | 2.0 | - |
| 2024-04-28 1400 | NE | 14.0 | - | 4.9 | - | - | - | 29.71 | -0.08 | 46.8 | - | 40.5 | - | 1.0 | - |
| 2024-04-28 1300 | ENE | 13.0 | - | 3.9 | - | - | - | 29.74 | -0.07 | 47.5 | - | 42.1 | - | 2.0 | - |
| 2024-04-28 1200 | ENE | 11.1 | - | 3.3 | - | - | - | 29.77 | -0.06 | 48.6 | - | 42.6 | - | 2.0 | - |
| 2024-04-28 1100 | NE | 9.9 | - | 3.3 | - | - | - | 29.79 | -0.06 | 49.3 | - | 42.6 | - | 5.0 | - |
| 2024-04-28 1000 | NE | 8.9 | - | 3.3 | - | - | - | 29.81 | -0.04 | 49.6 | - | 43.3 | - | 27.0 | - |
| 2024-04-28 0900 | ENE | 8.9 | - | 3.0 | - | - | - | 29.83 | -0.03 | 49.8 | - | 44.2 | - | 11.0 | - |
| 2024-04-28 0800 | ENE | 7.0 | - | 3.0 | - | - | - | 29.85 | -0.02 | 49.8 | - | 44.1 | - | 27.0 | - |
| 2024-04-28 0700 | E | 7.0 | - | 3.3 | - | - | - | 29.86 | -0.02 | 48.7 | - | 43.5 | - | 11.0 | - |
| 2024-04-28 0600 | E | 8.0 | - | 3.3 | - | - | - | 29.86 | -0.03 | 48.9 | - | 43.5 | - | 11.0 | - |
| 2024-04-28 0500 | ENE | 11.1 | - | 3.0 | - | - | - | 29.87 | -0.04 | 48.9 | - | 41.7 | - | 27.0 | - |
| 2024-04-28 0400 | NE | 9.9 | - | 3.0 | - | - | - | 29.88 | -0.04 | 51.3 | - | 42.3 | - | 27.0 | - |
| 2024-04-28 0300 | NE | 9.9 | - | 3.0 | - | - | - | 29.89 | -0.04 | 49.8 | - | 43.5 | - | 27.0 | - |
| 2024-04-28 0200 | NE | 8.9 | - | 2.6 | - | - | - | 29.90 | -0.03 | 50.7 | - | 42.1 | - | 27.0 | - |
|
These wave data are displayed in rounded times. Click on the graph icon in the table below to see a time series plot of the last 24 hours of that observation. | |
| 9.8 ft | |
| 9.8 ft | |
| TIME (GMT) |
WVHT ft |
SwH ft |
SwP sec |
SwD |
WWH ft |
WWP sec |
WWD |
STEEPNESS |
APD sec |
|---|---|---|---|---|---|---|---|---|---|
| 2024-04-28 1800 | 6.6 | - | - | - | 6.6 | - | - | N/A | - |
| 2024-04-28 1200 | 3.3 | - | - | - | 3.3 | - | - | N/A | - |
| 2024-04-28 0600 | 3.3 | - | - | - | 3.3 | - | - | N/A | - |