Skip Navigation Links weather.gov 
NOAA logo-Select to go to the NOAA homepage NDBC Title GraphicClick to go to NDBC home page   Select to go to the NWS homepage
Home News Organization


    Station List

 Observations
    Mobile Access
    Observations via
      Google Maps

    Classic Maps
         Recent
         Historical
         DART®
         MMS ADCP
    Obs Search
    Ship Obs Report
    APEX
    TAO
    DODS
    HF Radar
    OSMC
    Dial-A-Buoy
    RSS Feeds Image indicating link to RSS feed access page
    Email Access

 Station Status
    NDBC Maintenance
    NDBC Platforms
    Partner Platforms

 Program Info
    About NDBC
     Met/Ocean
          Moored Buoy
          C-MAN
    TAO
    DART®
    VOS
    CSP
    IOOS® DAC

 Publications
    NDBC DQC Handbook
    Hurricane Data Plots
    Mariners Weather
      Log

    Observing
      Handbook No. 1


 Science Education

 FAQ
 Contact Us
 Links
 
USA.gov is the U.S. government's official web portal to all federal, state and local government web resources and services.

Station 62125 Image indicating link to RSS feed of recent meteorological observations for station 62125

Station 62125

Owned and maintained by Private Industry
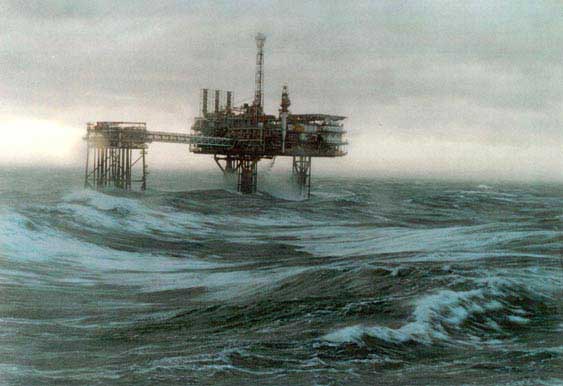
Oil Platform
53.800 N 3.500 W (53°48'0" N 3°30'0" W)

Search And Rescue (SAR) Data

Meteorological Observations from Nearby Stations and Ships Image indicating link to RSS feed of recent meteorological observations near station 62125

The QuikSCAT wind data are no longer available.

Data from this station are not quality controlled by NDBC


Conditions at 62125 as of
0500 GMT on 02/10/2010:
Unit of Measure:    Time Zone:   

Click on the graph icon in the table below to see a time series plot of the last 24 hours of that observation.

24-hour plot - Wind DirectionWind Direction (WDIR): N ( 350 deg true )
24-hour plot - Wind SpeedWind Speed (WSPD): 9.9 kts
24-hour plot - Wave HeightWave Height (WVHT): 2.6 ft
24-hour plot - Average PeriodAverage Period (APD): 3 sec
24-hour plot - Atmospheric PressureAtmospheric Pressure (PRES):30.11 in
24-hour plot - Pressure TendencyPressure Tendency (PTDY):+0.01 in ( Rising )
24-hour plot - Air TemperatureAir Temperature (ATMP): 37.0 °F
24-hour plot - Dew PointDew Point (DEWP): 28.6 °F
24-hour plot - VisibilityVisibility (VIS): 11.0 nmi
24-hour plot - Wind ChillWind Chill (CHILL): 29.3 °F
24-hour plot - Wind Speed, Wind Gust and Atmospheric PressureCombined plot of Wind Speed, Gust, and Air Pressure

Data from this station are not quality controlled by NDBC

Previous observations
24-hour plot - Wind Direction24-hour plot - Wind Speed24-hour plot - Wind Gust24-hour plot - Wave Height24-hour plot - Dominant Wave Period24-hour plot - Average Period24-hour plot - Mean Wave Direction24-hour plot - Atmospheric Pressure24-hour plot - Pressure Tendency24-hour plot - Air Temperature24-hour plot - Water Temperature24-hour plot - Dew Point24-hour plot - Salinity24-hour plot - Visibility24-hour plot - Tide (above MLLW)
MM DD TIME
(GMT)
   WDIR WSPD
kts
GST
kts
WVHT
ft
DPD
sec
APD
sec
MWD PRES
in
PTDY
in
ATMP
°F
WTMP
°F
DEWP
°F
SAL
psu
VIS
nmi
TIDE
ft
02100400    N 17.1- 3.0- 3-30.11-0.00 37.4- 28.4- 11.0-
02100300    N 15.0- 2.6- 3-30.11-0.01 37.8- 28.4- 11.0-
02100200    N 15.0- 2.6- 3-30.10-0.01 37.9- 28.8- 11.0-
02100100    N 13.0- 2.3- 3-30.11+0.00 38.1- 29.5- 11.0-
02100000    N 13.0- 2.3- 3-30.11+0.01 38.5- 30.2- 11.0-
02092300    N 13.0- 2.0- 3-30.11+0.00 38.5- 30.6- 11.0-
02092200    N 15.0- 2.0- 3-30.11+0.01 38.8- 31.1- 11.0-
02092100    N 11.1- 2.0- 3-30.11+0.03 39.2- 31.6- 11.0-
02092000    N 12.0- 2.3- 3-30.11+0.04 39.6- 31.6- 11.0-
02091900    N 15.9- 2.3- 3-30.09+0.03 39.6- 31.8- 11.0-
02091800    N 14.0- 2.0- 3-30.08+0.02 39.7- 31.6- 11.0-
02091700    N 13.0- 2.3- 3-30.07+0.02 39.7- 31.6- 11.0-
02091600    N 13.0- 2.3- 3-30.06+0.00 39.4- 30.6- 11.0-
02091500   NNE 12.0- 2.6- 3-30.05-0.00 39.2- 29.7- 27.0-
02091400   NNE 15.9- 3.0- 3-30.05-0.01 38.7- 30.0- 11.0-
02091300    N 14.0- 3.3- 3-30.06+0.00 37.9- 30.4- 11.0-
02091200    N 17.1- 3.0- 3-30.06- 37.6- 29.8- 11.0-
02091100    N 17.1- 2.6- 3-30.06+0.01 37.2- 29.7- 11.0-
02091000    N 13.0- 2.6- 3-30.05+0.02 37.6- 30.4- 11.0-
02090800    N 15.9- 2.6- 3-30.05+0.03 37.9- 30.0- 11.0-
02090700    N 15.9- 3.0- 4-30.03+0.01 37.9- 30.2- 11.0-
02090600    N 15.9- 3.0- 3-30.02+0.00 38.5- 30.4- 11.0-
02090500    N 15.0- 2.3- 3-30.02-0.01 38.3- 31.3- 11.0-

Description of Measurements


U.S. Dept. of Commerce
National Oceanic and Atmospheric Administration
National Weather Service
National Data Buoy Center
    1007 Balch Blvd.
    Stennis Space Center, MS 39529
Contact Us
Page last modified: January 26, 2010
Disclaimer
Information Quality
Credits
Glossary
Privacy Policy
Freedom of Information
About Us
Career Opportunities