Skip Navigation Links weather.gov 
NOAA logo-Select to go to the NOAA homepage NDBC Title GraphicClick to go to NDBC home page   Select to go to the NWS homepage
Home News Organization


    Station List

 Observations
    Mobile Access
    Observations via
      Google Maps

    Classic Maps
         Recent
         Historical
         DART®
         MMS ADCP
    Obs Search
    Ship Obs Report
    APEX
    TAO
    DODS
    HF Radar
    OSMC
    Dial-A-Buoy
    RSS Feeds Image indicating link to RSS feed access page
    Email Access

 Station Status
    NDBC Maintenance
    NDBC Platforms
    Partner Platforms

 Program Info
    About NDBC
     Met/Ocean
          Moored Buoy
          C-MAN
    TAO
    DART®
    VOS
    CSP
    IOOS® DAC

 Publications
    NDBC DQC Handbook
    Hurricane Data Plots
    Mariners Weather
      Log

    Observing
      Handbook No. 1


 Science Education

 FAQ
 Contact Us
 Links
 
USA.gov is the U.S. government's official web portal to all federal, state and local government web resources and services.

Station 62095 - M6 - West Coast Image indicating link to RSS feed of recent meteorological observations for station 62095

Station 62095

Owned by the Irish Department of Transport and maintained by the Marine Institute in cooperation with Met Eireann and the UK Met Office.
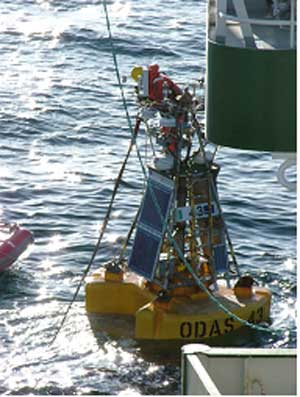
2.5-meter ODAS buoy
53.056 N 15.924 W (53°3'22" N 15°55'28" W)

Site elevation: sea level
Air temp height: 3.8 m above site elevation
Anemometer height: 4.5 m above site elevation
Barometer elevation: 4.5 m above mean sea level
Sea temp depth: 1 m below site elevation
Water depth: 3000.1 m
Watch circle radius: 7454 yards

Search And Rescue (SAR) Data

Meteorological Observations from Nearby Stations and Ships Image indicating link to RSS feed of recent meteorological observations near station 62095

Latest Satellite Wind Map for this Area

Data from this station are not quality controlled by NDBC


Conditions at 62095 as of
0200 GMT on 11/25/2009:
Unit of Measure:    Time Zone:   

Click on the graph icon in the table below to see a time series plot of the last 24 hours of that observation.

24-hour plot - Wind DirectionWind Direction (WDIR): W ( 280 deg true )
24-hour plot - Wind SpeedWind Speed (WSPD):14.4 m/s
24-hour plot - Wave HeightWave Height (WVHT): 6.7 m
24-hour plot - Average PeriodAverage Period (APD): 9 sec
24-hour plot - Atmospheric PressureAtmospheric Pressure (PRES):981.2 mb
24-hour plot - Pressure TendencyPressure Tendency (PTDY): +0.4 mb ( Rising )
24-hour plot - Air TemperatureAir Temperature (ATMP): 10.6 °C
24-hour plot - Water TemperatureWater Temperature (WTMP): 12.5 °C
24-hour plot - Dew PointDew Point (DEWP): 7.6 °C
24-hour plot - Wind ChillWind Chill (CHILL): 6.2 °C
24-hour plot - Wind Speed, Wind Gust and Atmospheric PressureCombined plot of Wind Speed, Gust, and Air Pressure

Data from this station are not quality controlled by NDBC

Previous observations
24-hour plot - Wind Direction24-hour plot - Wind Speed24-hour plot - Wind Gust24-hour plot - Wave Height24-hour plot - Dominant Wave Period24-hour plot - Average Period24-hour plot - Mean Wave Direction24-hour plot - Atmospheric Pressure24-hour plot - Pressure Tendency24-hour plot - Air Temperature24-hour plot - Water Temperature24-hour plot - Dew Point24-hour plot - Salinity24-hour plot - Visibility24-hour plot - Tide (above MLLW)
MM DD TIME
(GMT)
   WDIR WSPD
m/s
GST
m/s
WVHT
m
DPD
sec
APD
sec
MWD PRES
mb
PTDY
mb
ATMP
°C
WTMP
°C
DEWP
°C
SAL
psu
VIS
km
TIDE
m
11250100   WSW 17.5- 8.2- 9-981.2 +0.1 9.3 12.5 7.0---
11250000   WSW 19.0- 7.7- 9-980.8 -0.7 8.9 12.5 6.3---
11242300   WSW 18.5- 8.1- 9-980.8 -1.2 9.3 12.5 5.1---
11242200   WSW 18.0- 8.0- 9-981.2 -1.5 8.4 12.5 4.1---
11242100   WSW 19.6- 7.6- 9-981.6 -1.6 9.2 12.5 4.7---
11242000   WSW 18.5- 7.9- 9-982.2 -1.5 9.3 12.5 3.9---
11241900   WSW 18.0- 7.6- 10-982.8 -1.6 8.7 12.5 4.0---
11241800   WSW 17.5- 7.7- 9-983.2 -1.7 8.1 12.5 3.3---
11241700   WSW 18.0- 7.5- 9-983.6 -1.4 9.1 12.5 4.2---
11241600   WSW 16.5- 7.8- 9-984.4 -1.2 8.6 12.5 4.6---
11241500   WSW 16.0- 6.6- 9-984.8 -0.5 8.9 12.5 4.9---
11241400   WSW 17.0- 6.2- 9-985.0 -0.8 9.0 12.5 2.7---
11241300   WSW 16.5- 6.4- 8-985.4 +0.4 8.9 12.5 3.1---
11241200   WSW 16.5- 6.5- 9-985.4 +0.3 9.3 12.5 3.7---
11241100   WSW 15.4- 6.6- 8-985.8 +1.6 9.4 12.5 4.6---
11241000   WSW 16.0- 6.2- 9-985.2 +0.9 9.9 12.5 4.5---
11240900   WSW 15.4- 5.3- 8-985.2 +0.6 10.1 12.5 4.2---
11240800    W 16.5- 5.5- 8-984.2 -0.9 10.4 12.6 4.8---
11240700   WSW 14.9- 4.8- 8-984.2 -1.9 9.8 12.6 5.3---
11240600   WSW 14.9- 4.8- 8-984.4 -2.8 10.5 12.6 7.5---
11240500   WSW 13.9- 4.1- 8-985.2 -2.8 10.8 12.6 8.3---
11240400   WSW 10.8- 4.5- 8-986.0 -3.3 11.0 12.5 9.4---
11240300   WSW 11.3- 4.2- 8-987.4 -2.1 11.5 12.6 9.6---

Description of Measurements


U.S. Dept. of Commerce
National Oceanic and Atmospheric Administration
National Weather Service
National Data Buoy Center
    1007 Balch Blvd.
    Stennis Space Center, MS 39529
Contact Us
Page last modified: October 27, 2009
Disclaimer
Information Quality
Credits
Glossary
Privacy Policy
Freedom of Information
About Us
Career Opportunities