


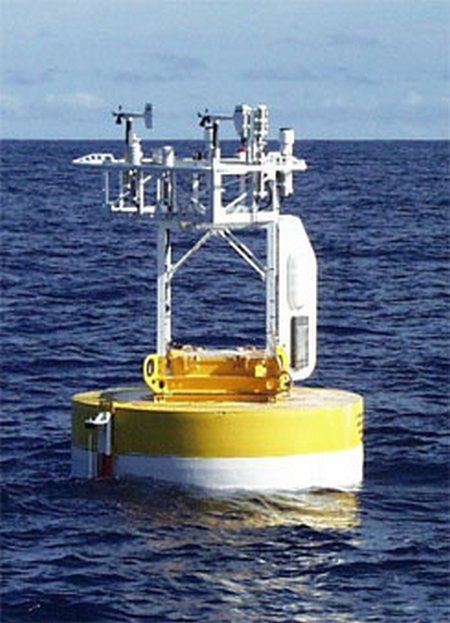
Station 51WH0 - WHOTS - Woods Hole Ocean Time-series 
Owned and maintained by Woods Hole Oceanographic Institution
Moored Buoy
WAMDAS payload
22.750 N 158.000 W (22°45'0" N 158°0'0" W)
Site elevation: sea level
Air temp height: 2.45 m above site elevation
Anemometer height: 2.66 m above site elevation
Barometer elevation: 2.43 m above mean sea level
Sea temp depth: 1.5 m below water line
Water depth: 4705 m
(24 hours for tsunami stations)
|
Click on the graph icon in the table below to see a time series plot of the last five days of that observation. | |
| ENE ( 70 deg true ) | |
| 6.0 m/s | |
| 1019.6 mb | |
| 22.3 °C | |
| 23.9 °C | |
| 35.00 psu | |
| 16.7 °C | |
| 6 m/s | |
| 7 m/s | |
| TIME (GMT) |
WDIR |
WSPD m/s |
GST m/s |
WVHT m |
DPD sec |
APD sec |
MWD |
PRES mb |
PTDY mb |
ATMP °C |
WTMP °C |
DEWP °C |
SAL psu |
VIS km |
TIDE m |
|---|---|---|---|---|---|---|---|---|---|---|---|---|---|---|---|
| 2024-04-19 1230 | ENE | 6.0 | - | - | - | - | - | 1020.1 | - | 22.5 | 23.9 | 16.0 | 35.00 | - | - |
| 2024-04-19 1130 | ENE | 5.0 | - | - | - | - | - | 1020.8 | - | 22.4 | 23.9 | 16.3 | 35.00 | - | - |
| 2024-04-19 1030 | ENE | 6.0 | - | - | - | - | - | 1021.0 | - | 22.4 | 23.9 | 16.7 | 35.00 | - | - |
| 2024-04-18 1930 | NE | 8.0 | - | - | - | - | - | 1020.2 | - | 20.8 | 23.8 | 18.4 | 35.00 | - | - |
| 2024-04-18 1830 | NNE | 9.0 | - | - | - | - | - | 1019.8 | - | 20.9 | 23.8 | 18.4 | 35.00 | - | - |
| 2024-04-18 1730 | NE | 9.0 | - | - | - | - | - | 1019.5 | - | 20.5 | 23.8 | 19.2 | 35.00 | - | - |
| 2024-04-18 1630 | NE | 9.0 | - | - | - | - | - | 1018.6 | - | 20.4 | 23.8 | 19.4 | 35.00 | - | - |
| 2024-04-18 1530 | NE | 9.0 | - | - | - | - | - | 1018.0 | - | 20.5 | 23.8 | 19.5 | 35.00 | - | - |
| 2024-04-18 1430 | NE | 8.0 | - | - | - | - | - | 1017.7 | - | 20.6 | 23.9 | 19.6 | 35.00 | - | - |
|
These oceanographic data are displayed in rounded times. Click on the graph icon in the table below to see a time series plot of the last five days of that observation. | |
| Depth (DEPTH): | 1.0 m |
| 23.90 °C | |
| 35.00 psu | |
| TIME (GMT) |
DEPTH m |
OTMP °C |
COND mS/cm |
SAL psu |
O2% % |
O2PPM ppm |
CLCON ug/l |
TURB FTU |
PH |
EH mv |
|---|---|---|---|---|---|---|---|---|---|---|
| 2024-04-19 1230 | 1.0 | 23.90 | - | 35.00 | - | - | - | - | - | - |
| 2024-04-19 1130 | 1.0 | 23.90 | - | 35.00 | - | - | - | - | - | - |
| 2024-04-19 1030 | 1.0 | 23.90 | - | 35.00 | - | - | - | - | - | - |
| 2024-04-18 1930 | 1.0 | 23.80 | - | 35.00 | - | - | - | - | - | - |
| 2024-04-18 1830 | 1.0 | 23.80 | - | 35.00 | - | - | - | - | - | - |
| 2024-04-18 1730 | 1.0 | 23.80 | - | 35.00 | - | - | - | - | - | - |
| 2024-04-18 1630 | 1.0 | 23.80 | - | 35.00 | - | - | - | - | - | - |
| 2024-04-18 1530 | 1.0 | 23.80 | - | 35.00 | - | - | - | - | - | - |
| 2024-04-18 1430 | 1.0 | 23.90 | - | 35.00 | - | - | - | - | - | - |
|
Click on the graph icon in the table below to see a time series plot of the last five days of that observation. | ||
| 6.0 | watts/meter2 | |
| 358.4 | watts/meter2 | |
| TIME (GMT) |
SRAD1 w/m2 |
SRAD2 w/m2 |
LRAD w/m2 |
|---|---|---|---|
| 2024-04-19 1230 | - | 6.0 | 365.1 |
| 2024-04-19 1130 | - | 6.1 | 398.0 |
| 2024-04-19 1030 | - | 6.2 | 405.6 |
| 2024-04-18 1930 | - | 289.9 | 415.4 |
| 2024-04-18 1830 | - | 200.8 | 405.4 |
| 2024-04-18 1730 | - | 93.0 | 409.1 |
| 2024-04-18 1630 | - | 19.1 | 411.3 |
| 2024-04-18 1530 | - | 6.4 | 412.3 |
| 2024-04-18 1430 | - | 6.5 | 405.3 |
Links which are specific to this station are listed below:
Real Time Data in tabular form for the last forty-five days.
Historical Data & Climatic Summaries for quality controlled data for prior months and years.