


Station 51100 - NORTHERN HAWAII TWO - 252NM NE of Honolulu, HI
Owned and maintained by National Data Buoy Center
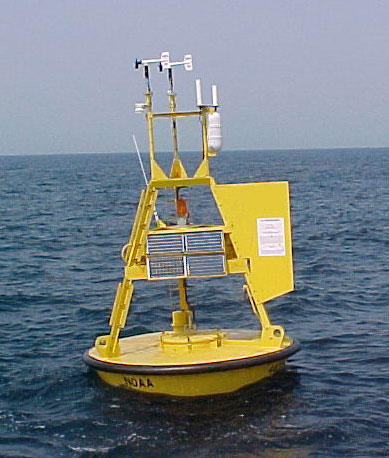
3-meter discus buoy
AMPS payload
23.558 N 153.900 W (23°33'30" N 153°54'0" W)
Site elevation: sea level
Air temp height: 4 m above site elevation
Anemometer height: 5 m above site elevation
Barometer elevation: sea level
Sea temp depth: 0.6 m below water line
Water depth: 4754.9 m
Watch circle radius: 4275 yards
Station 51100 went adrift on 3/26/2015 and ceased all transmissions on 4/28/2015. The station was disestablished on 8/6/2015.
(24 hours for tsunami stations)
No Recent Reports
Links which are specific to this station are listed below:
Data for last 24 hours: No data available.
Data for last 5 days: No data available.
Data for last 45 days: No data available.
- Historical data (data descriptions)
- Standard meteorological data: 2009 2010 2011 2012 2013 2014 2015
- Continuous winds data: 2009 2010 2011 2012 2013 2014 2015
- Spectral wave density data: 2009 2010 2011 2012 2013 2014 2015
- Spectral wave (alpha1) direction data: 2009 2010 2011 2012 2013 2014 2015
- Spectral wave (alpha2) direction data: 2009 2010 2011 2012 2013 2014 2015
- Spectral wave (r1) direction data: 2009 2010 2011 2012 2013 2014 2015
- Spectral wave (r2) direction data: 2009 2010 2011 2012 2013 2014 2015
- Search historical meteorological data for observations that meet your threshold conditions
Some data files have been compressed with the GNU gzip program.
The weekly status report and the weekly maintenance report also provide valuable station information.
Note that the payload types and the station locations occasionally change.