


Station 44032 - Buoy E01 - Central Maine Shelf 
Owned and maintained by Northeastern Regional Association of Coastal Ocean Observing Systems
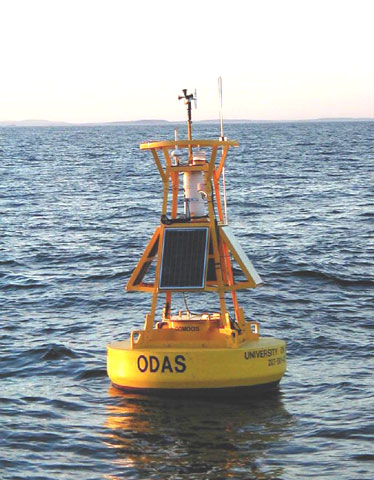
Moored Buoy
43.715 N 69.355 W (43°42'53" N 69°21'18" W)
Site elevation: sea level
Air temp height: 3 m above site elevation
Anemometer height: 4 m above site elevation
Barometer elevation: 3 m above mean sea level
Sea temp depth: 1 m below water line
Water depth: 100 m
Watch circle radius: 50 yards
Caution: Right whales may be active in northeast waters year-round. NOAA may establish temporary Dynamic Management Areas (DMAs) to protect aggregations of right whales. Mariners are requested to transit DMAs at 10 knots or less when consistent with safe navigation. For information on currently active DMAs, go to: http://www.nmfs.noaa.gov/pr/shipstrike
Large icon indicates selected station.
 Stations with recent data
 Stations with no data in last 8 hours
(24 hours for tsunami stations)
(24 hours for tsunami stations)
|
Click on the graph icon in the table below to see a time series plot of the last five days of that observation. | |
| SSW ( 210 deg true ) | |
| 1.0 m/s | |
| 2.0 m/s | |
| 0.5 m | |
| 11 sec | |
| 1022.2 mb | |
| 6.2 °C | |
| 3.0 km | |
| 1 m/s | |
| 2 m/s | |
| TIME (GMT) |
WDIR |
WSPD m/s |
GST m/s |
WVHT m |
DPD sec |
APD sec |
MWD |
PRES mb |
PTDY mb |
ATMP °C |
WTMP °C |
DEWP °C |
SAL psu |
VIS km |
TIDE m |
|---|---|---|---|---|---|---|---|---|---|---|---|---|---|---|---|
| 2024-04-19 0504 | W | 2.0 | 3.0 | 0.5 | 11 | - | - | 1022.8 | - | 6.4 | - | - | - | 3.0 | - |
| 2024-04-19 0404 | W | 3.0 | 4.0 | 0.5 | 11 | - | - | 1022.8 | - | 6.3 | - | - | - | 3.0 | - |
| 2024-04-19 0204 | ENE | 1.0 | 1.0 | 0.6 | 11 | - | - | 1022.3 | - | 5.9 | - | - | - | 3.0 | - |
| 2024-04-19 0104 | W | 1.0 | 2.0 | 0.6 | 11 | - | - | 1022.7 | - | 5.7 | - | - | - | 3.0 | - |
| 2024-04-19 0004 | - | 0.0 | 1.0 | 0.6 | 11 | - | - | 1022.4 | - | 5.7 | - | - | - | 3.0 | - |
| 2024-04-18 2304 | E | 1.0 | 2.0 | 0.7 | 11 | - | - | 1022.6 | - | 6.1 | - | - | - | 3.0 | - |
| 2024-04-18 2204 | - | 0.0 | 1.0 | 0.6 | 8 | - | - | 1023.0 | - | 7.2 | - | - | - | 3.0 | - |
| 2024-04-18 2004 | E | 2.0 | 3.0 | 0.4 | 3 | - | - | 1022.8 | - | 7.4 | - | - | - | 3.0 | - |
| 2024-04-18 1904 | E | 4.0 | 5.0 | 0.5 | 4 | - | - | 1023.1 | - | 7.1 | - | - | - | 3.0 | - |
| 2024-04-18 1804 | E | 5.0 | 6.0 | 0.5 | 3 | - | - | 1023.3 | - | 6.5 | - | - | - | 3.0 | - |
| 2024-04-18 1704 | E | 5.0 | 6.0 | 0.5 | 3 | - | - | 1023.3 | - | 6.2 | - | - | - | 3.0 | - |
| 2024-04-18 1604 | E | 6.0 | 7.0 | 0.5 | 3 | - | - | 1023.1 | - | 6.0 | - | - | - | 3.0 | - |
| 2024-04-18 1504 | ENE | 6.0 | 8.0 | 0.6 | 3 | - | - | 1023.3 | - | 6.2 | - | - | - | 3.0 | - |
| 2024-04-18 1404 | ENE | 7.0 | 8.0 | 0.6 | 3 | - | - | 1023.1 | - | 6.1 | - | - | - | 3.0 | - |
| 2024-04-18 1304 | ENE | 6.0 | 7.0 | 0.6 | 3 | - | - | 1023.0 | - | 6.2 | - | - | - | 3.0 | - |
| 2024-04-18 1204 | ENE | 7.0 | 8.0 | 0.6 | 3 | - | - | 1022.8 | - | 5.9 | - | - | - | 3.0 | - |
| 2024-04-18 1104 | ENE | 7.0 | 8.0 | 0.6 | 3 | - | - | 1022.4 | - | 5.9 | - | - | - | 3.0 | - |
| 2024-04-18 1004 | ENE | 7.0 | 9.0 | 0.8 | 8 | - | - | 1021.8 | - | 5.9 | - | - | - | 3.0 | - |
| 2024-04-18 0904 | ENE | 7.0 | 8.0 | 0.8 | 8 | - | - | 1021.8 | - | 6.2 | - | - | - | 3.0 | - |
Links which are specific to this station are listed below:
Real Time Data in tabular form for the last forty-five days.
Historical Data & Climatic Summaries for quality controlled data for prior months and years.