


Station 42023 - C13 - WFS South Buoy, 50m Isobath 
Owned and maintained by COMPS (University of South Florida)
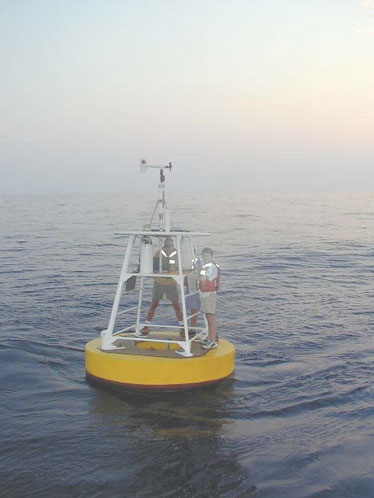
Offshore Buoy
26.010 N 83.086 W (26°0'36" N 83°5'10" W)
Site elevation: sea level
Air temp height: 2 m above site elevation
Anemometer height: 3.1 m above site elevation
Barometer elevation: 1.9 m above mean sea level
Sea temp depth: 1 m below water line
Water depth: 50 m
(24 hours for tsunami stations)
|
Click on the graph icon in the table below to see a time series plot of the last five days of that observation. | |
| S ( 180 deg true ) | |
| 2.0 m/s | |
| 3.0 m/s | |
| 1018.8 mb | |
| 24.6 °C | |
| 24.5 °C | |
| 19.5 °C | |
| 3 m/s | |
| 3 m/s | |
| TIME (GMT) |
WDIR |
WSPD m/s |
GST m/s |
WVHT m |
DPD sec |
APD sec |
MWD |
PRES mb |
PTDY mb |
ATMP °C |
WTMP °C |
DEWP °C |
SAL psu |
VIS km |
TIDE m |
|---|---|---|---|---|---|---|---|---|---|---|---|---|---|---|---|
| 2024-04-25 2205 | SSE | 3.0 | 3.0 | - | - | - | - | 1018.9 | - | 24.6 | 24.5 | 19.6 | - | - | - |
| 2024-04-25 2135 | SE | 2.0 | 3.0 | - | - | - | - | 1019.0 | - | 24.6 | 24.5 | 19.5 | - | - | - |
| 2024-04-25 2105 | SE | 3.0 | 4.0 | - | - | - | - | 1019.1 | - | 24.3 | 24.4 | 19.5 | - | - | - |
| 2024-04-25 2035 | SE | 4.0 | 4.0 | - | - | - | - | 1019.4 | - | 24.2 | 24.4 | 19.8 | - | - | - |
| 2024-04-25 2005 | SE | 4.0 | 5.0 | - | - | - | - | 1019.5 | - | 24.3 | 24.3 | 19.9 | - | - | - |
| 2024-04-25 1935 | ESE | 4.0 | 5.0 | - | - | - | - | 1019.6 | - | 24.1 | 24.2 | 19.4 | - | - | - |
| 2024-04-25 1905 | SE | 4.0 | 5.0 | - | - | - | - | 1020.0 | - | 24.1 | 24.2 | 19.8 | - | - | - |
| 2024-04-25 1835 | ESE | 5.0 | 6.0 | - | - | - | - | 1020.4 | - | 24.1 | 24.1 | 19.8 | - | - | - |
| 2024-04-25 1805 | ESE | 5.0 | 7.0 | - | - | - | - | 1020.7 | - | 24.0 | 24.1 | 20.1 | - | - | - |
| 2024-04-25 1735 | ESE | 6.0 | 7.0 | - | - | - | - | 1021.0 | - | 24.0 | 24.1 | 20.1 | - | - | - |
| 2024-04-25 1705 | ESE | 6.0 | 7.0 | - | - | - | - | 1021.3 | - | 24.1 | 24.1 | 20.2 | - | - | - |
| 2024-04-25 1635 | ESE | 4.0 | 5.0 | - | - | - | - | 1021.6 | - | 24.0 | 24.1 | 20.7 | - | - | - |
| 2024-04-25 1605 | ESE | 5.0 | 6.0 | - | - | - | - | 1021.6 | - | 23.9 | 24.0 | 20.5 | - | - | - |
| 2024-04-25 1535 | ESE | 5.0 | 6.0 | - | - | - | - | 1021.5 | - | 23.9 | 23.9 | 20.0 | - | - | - |
| 2024-04-25 1505 | E | 4.0 | 5.0 | - | - | - | - | 1021.5 | - | 23.7 | 23.9 | 20.6 | - | - | - |
| 2024-04-25 1435 | E | 4.0 | 5.0 | - | - | - | - | 1021.5 | - | 23.6 | 23.9 | 20.2 | - | - | - |
| 2024-04-25 1405 | E | 4.0 | 5.0 | - | - | - | - | 1021.4 | - | 23.6 | 23.8 | 19.2 | - | - | - |
| 2024-04-25 1335 | ENE | 5.0 | 6.0 | - | - | - | - | 1021.6 | - | 23.4 | 23.8 | 18.8 | - | - | - |
| 2024-04-25 1305 | ENE | 5.0 | 6.0 | - | - | - | - | 1021.6 | - | 23.2 | 23.8 | 19.1 | - | - | - |
| 2024-04-25 1235 | ENE | 5.0 | 6.0 | - | - | - | - | 1021.4 | - | 23.2 | 23.8 | 19.4 | - | - | - |
| 2024-04-25 1205 | NE | 5.0 | 6.0 | - | - | - | - | 1021.3 | - | 23.1 | 23.8 | 19.4 | - | - | - |
| 2024-04-25 1135 | NE | 5.0 | 6.0 | - | - | - | - | 1021.0 | - | 23.0 | 23.9 | 19.4 | - | - | - |
| 2024-04-25 1105 | ENE | 5.0 | 6.0 | - | - | - | - | 1020.5 | - | 22.9 | 23.9 | 19.5 | - | - | - |
| 2024-04-25 1035 | NE | 4.0 | 5.0 | - | - | - | - | 1020.4 | - | 23.2 | 23.9 | 19.3 | - | - | - |
| 2024-04-25 1005 | NE | 4.0 | 5.0 | - | - | - | - | 1020.1 | - | 23.1 | 23.9 | 19.2 | - | - | - |
| 2024-04-25 0935 | NE | 4.0 | 6.0 | - | - | - | - | 1019.7 | - | 23.2 | 23.9 | 19.3 | - | - | - |
| 2024-04-25 0905 | NE | 5.0 | 6.0 | - | - | - | - | 1019.7 | - | 23.2 | 23.9 | 19.1 | - | - | - |
| 2024-04-25 0835 | NE | 4.0 | 6.0 | - | - | - | - | 1020.0 | - | 23.3 | 23.9 | 19.4 | - | - | - |
| 2024-04-25 0805 | NNE | 4.0 | 4.0 | - | - | - | - | 1020.0 | - | 23.3 | 24.0 | 19.3 | - | - | - |
| 2024-04-25 0735 | NE | 3.0 | 4.0 | - | - | - | - | 1020.1 | - | 23.4 | 24.0 | 19.4 | - | - | - |
| 2024-04-25 0705 | NE | 3.0 | 3.0 | - | - | - | - | 1020.2 | - | 23.3 | 24.0 | 19.4 | - | - | - |
| 2024-04-25 0635 | NNE | 2.0 | 3.0 | - | - | - | - | 1020.4 | - | 23.3 | 24.0 | 19.4 | - | - | - |
| 2024-04-25 0605 | NNE | 2.0 | 2.0 | - | - | - | - | 1020.5 | - | 23.4 | 24.0 | 19.3 | - | - | - |
| 2024-04-25 0535 | N | 2.0 | 2.0 | - | - | - | - | 1020.6 | - | 23.5 | 24.0 | 19.3 | - | - | - |
| 2024-04-25 0505 | N | 1.0 | 2.0 | - | - | - | - | 1020.8 | - | 23.5 | 24.0 | 19.3 | - | - | - |
| 2024-04-25 0435 | N | 1.0 | 2.0 | - | - | - | - | 1021.0 | - | 23.6 | 24.0 | 19.4 | - | - | - |
| 2024-04-25 0405 | N | 1.0 | 2.0 | - | - | - | - | 1021.2 | - | 23.7 | 24.0 | 19.4 | - | - | - |
| 2024-04-25 0335 | N | 1.0 | 2.0 | - | - | - | - | 1021.2 | - | 23.7 | 24.0 | 19.4 | - | - | - |
| 2024-04-25 0305 | NNE | 1.0 | 1.0 | - | - | - | - | 1021.0 | - | 23.8 | 24.0 | 19.3 | - | - | - |
| 2024-04-25 0235 | N | 1.0 | 1.0 | - | - | - | - | 1021.0 | - | 23.8 | 24.0 | 19.2 | - | - | - |
| 2024-04-25 0205 | ENE | 1.0 | 1.0 | - | - | - | - | 1020.8 | - | 23.9 | 24.1 | 19.1 | - | - | - |
| 2024-04-25 0135 | ENE | 2.0 | 2.0 | - | - | - | - | 1020.6 | - | 23.9 | 24.1 | 19.0 | - | - | - |
| 2024-04-25 0105 | ENE | 2.0 | 2.0 | - | - | - | - | 1020.4 | - | 24.0 | 24.1 | 19.3 | - | - | - |
| 2024-04-25 0035 | ENE | 3.0 | 3.0 | - | - | - | - | 1020.0 | - | 24.0 | 24.1 | 19.3 | - | - | - |
| 2024-04-25 0005 | E | 3.0 | 4.0 | - | - | - | - | 1019.9 | - | 24.0 | 24.1 | 19.5 | - | - | - |
Disclaimer: Ocean current directions are reported to the nearest 10 degrees and speeds are measured to the nearest whole centimeter per second.
Ocean Current Data for 42023
| 2157 GMT | 2057 GMT | |||
|---|---|---|---|---|
| Depth m | Dir ° | Speed cm/s |
Dir ° | Speed cm/s |
| 3 | 330 | 13.0 | 300 | 19.0 |
| 4 | 310 | 19.0 | 300 | 19.0 |
| 5 | 310 | 17.0 | 290 | 19.0 |
| 6 | 300 | 16.0 | 290 | 16.0 |
| 7 | 310 | 16.0 | 280 | 18.0 |
| 8 | 270 | 7.0 | 270 | 14.0 |
| 9 | 280 | 7.0 | 270 | 10.0 |
| 10 | 260 | 13.0 | 250 | 17.0 |
| 11 | 270 | 18.0 | 260 | 21.0 |
| 12 | 270 | 12.0 | 250 | 17.0 |
| 13 | 280 | 13.0 | 250 | 19.0 |
| 14 | 270 | 18.0 | 250 | 18.0 |
| 15 | 270 | 15.0 | 250 | 20.0 |
| 16 | 270 | 15.0 | 250 | 17.0 |
| 17 | 280 | 16.0 | 260 | 22.0 |
| 18 | 260 | 5.0 | 250 | 8.0 |
| 19 | 280 | 12.0 | 260 | 15.0 |
| 20 | 270 | 14.0 | 260 | 15.0 |
| 21 | 270 | 14.0 | 260 | 15.0 |
| 22 | 270 | 14.0 | 250 | 17.0 |
| 23 | 270 | 11.0 | 250 | 15.0 |
| 24 | 270 | 12.0 | 250 | 13.0 |
| 25 | 280 | 10.0 | 260 | 15.0 |
| 26 | 270 | 9.0 | 250 | 13.0 |
| 27 | 260 | 11.0 | 250 | 15.0 |
| 28 | 260 | 13.0 | 240 | 16.0 |
| 29 | 250 | 13.0 | 250 | 17.0 |
| 30 | 250 | 13.0 | 240 | 17.0 |
| 31 | 250 | 15.0 | 240 | 18.0 |
| 32 | 250 | 15.0 | 240 | 18.0 |
| 33 | 240 | 13.0 | 240 | 16.0 |
| 34 | 230 | 13.0 | 240 | 17.0 |
| 35 | 240 | 14.0 | 240 | 15.0 |
| 36 | 240 | 15.0 | 240 | 13.0 |
| 37 | 230 | 14.0 | 240 | 15.0 |
| 38 | 230 | 17.0 | 230 | 16.0 |
| 39 | 230 | 18.0 | 240 | 15.0 |
| 40 | 230 | 19.0 | 230 | 15.0 |
| 41 | 230 | 19.0 | 240 | 13.0 |
| 42 | 240 | 16.0 | 240 | 16.0 |
Previous (up to 48) reports of ocean current data for 42023
Ocean Current Stick Plots are available in metric units only:
All Instruments -  1-day plot 3-day plot 5-day plot
Links which are specific to this station are listed below:
Real Time Data in tabular form for the last forty-five days.
Historical Data & Climatic Summaries for quality controlled data for prior months and years.