


Station 42091 - Trinity Shoal, LA (255) 
Information submitted by Scripps Institution of Oceanography
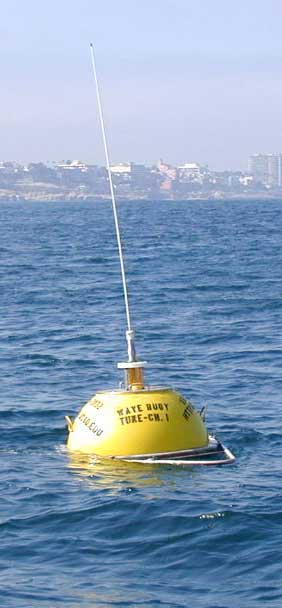
Waverider Buoy
29.087 N 92.506 W (29°5'12" N 92°30'23" W)
Site elevation: sea level
Sea temp depth: 0.46 m below water line
Water depth: 21.6 m
The highly endangered Rice's whale, a newly identified species, inhabit the northeastern Gulf of Mexico year-round along the continental shelf-break between 100m and 400m depth. Vessels can kill or injure whales - please use slow speeds and be prepared to avoid surfacing whales. To report sightings call 1-877-WHALE-HELP.
Large icon indicates selected station.
 Stations with recent data
 Stations with no data in last 8 hours
(24 hours for tsunami stations)
(24 hours for tsunami stations)
|
Click on the graph icon in the table below to see a time series plot of the last five days of that observation. | |
| 2.3 ft | |
| 6 sec | |
| 4.6 sec | |
| S ( 177 deg true ) | |
| 73.8 °F | |
| TIME (CDT) |
WDIR |
WSPD kts |
GST kts |
WVHT ft |
DPD sec |
APD sec |
MWD |
PRES in |
PTDY in |
ATMP °F |
WTMP °F |
DEWP °F |
SAL psu |
VIS nmi |
TIDE ft |
|---|---|---|---|---|---|---|---|---|---|---|---|---|---|---|---|
| 2024-04-20 04:56 am | - | - | - | 2.3 | 6 | 4.7 | S | - | - | - | 73.9 | - | - | - | - |
| 2024-04-20 03:56 am | - | - | - | 2.3 | 5 | 4.7 | S | - | - | - | 73.9 | - | - | - | - |
| 2024-04-20 03:26 am | - | - | - | 2.3 | 6 | 4.7 | S | - | - | - | 73.9 | - | - | - | - |
| 2024-04-20 02:56 am | - | - | - | 2.3 | 6 | 4.8 | S | - | - | - | 73.9 | - | - | - | - |
| 2024-04-20 02:26 am | - | - | - | 2.3 | 6 | 4.7 | S | - | - | - | 73.9 | - | - | - | - |
| 2024-04-20 01:56 am | - | - | - | 2.3 | 6 | 4.8 | S | - | - | - | 73.9 | - | - | - | - |
| 2024-04-20 01:26 am | - | - | - | 2.3 | 6 | 4.8 | S | - | - | - | 73.9 | - | - | - | - |
| 2024-04-20 12:56 am | - | - | - | 2.3 | 6 | 4.9 | S | - | - | - | 73.9 | - | - | - | - |
| 2024-04-20 12:26 am | - | - | - | 2.6 | 6 | 4.9 | S | - | - | - | 73.8 | - | - | - | - |
| 2024-04-19 11:56 pm | - | - | - | 2.6 | 6 | 4.9 | S | - | - | - | 73.8 | - | - | - | - |
| 2024-04-19 11:26 pm | - | - | - | 2.6 | 6 | 4.9 | S | - | - | - | 73.8 | - | - | - | - |
| 2024-04-19 10:56 pm | - | - | - | 2.6 | 6 | 5.0 | S | - | - | - | 73.9 | - | - | - | - |
| 2024-04-19 10:26 pm | - | - | - | 2.6 | 6 | 4.9 | S | - | - | - | 73.9 | - | - | - | - |
| 2024-04-19 09:56 pm | - | - | - | 2.6 | 6 | 4.9 | S | - | - | - | 74.1 | - | - | - | - |
| 2024-04-19 09:26 pm | - | - | - | 2.6 | 6 | 4.8 | S | - | - | - | 74.1 | - | - | - | - |
| 2024-04-19 08:56 pm | - | - | - | 2.6 | 6 | 4.9 | S | - | - | - | 74.3 | - | - | - | - |
| 2024-04-19 08:26 pm | - | - | - | 2.6 | 7 | 5.0 | SSE | - | - | - | 74.3 | - | - | - | - |
| 2024-04-19 07:56 pm | - | - | - | 2.3 | 6 | 4.8 | SSE | - | - | - | 74.3 | - | - | - | - |
| 2024-04-19 07:26 pm | - | - | - | 2.6 | 7 | 5.0 | S | - | - | - | 74.3 | - | - | - | - |
| 2024-04-19 06:56 pm | - | - | - | 2.6 | 6 | 5.1 | S | - | - | - | 74.1 | - | - | - | - |
| 2024-04-19 06:26 pm | - | - | - | 2.6 | 7 | 5.0 | S | - | - | - | 74.1 | - | - | - | - |
| 2024-04-19 05:56 pm | - | - | - | 2.6 | 6 | 5.1 | S | - | - | - | 74.3 | - | - | - | - |
| 2024-04-19 05:26 pm | - | - | - | 2.6 | 7 | 5.2 | S | - | - | - | 74.3 | - | - | - | - |
| 2024-04-19 04:56 pm | - | - | - | 2.6 | 7 | 5.1 | S | - | - | - | 74.5 | - | - | - | - |
| 2024-04-19 04:26 pm | - | - | - | 2.6 | 6 | 5.1 | S | - | - | - | 74.5 | - | - | - | - |
| 2024-04-19 03:56 pm | - | - | - | 2.6 | 7 | 5.1 | S | - | - | - | 74.7 | - | - | - | - |
| 2024-04-19 03:26 pm | - | - | - | 2.6 | 7 | 5.2 | S | - | - | - | 75.0 | - | - | - | - |
| 2024-04-19 02:56 pm | - | - | - | 3.0 | 7 | 5.1 | S | - | - | - | 74.8 | - | - | - | - |
| 2024-04-19 02:26 pm | - | - | - | 2.6 | 7 | 5.0 | S | - | - | - | 74.7 | - | - | - | - |
| 2024-04-19 01:56 pm | - | - | - | 3.0 | 6 | 5.1 | S | - | - | - | 74.5 | - | - | - | - |
| 2024-04-19 01:26 pm | - | - | - | 3.0 | 7 | 5.2 | S | - | - | - | 74.3 | - | - | - | - |
| 2024-04-19 12:56 pm | - | - | - | 3.0 | 6 | 5.2 | S | - | - | - | 74.5 | - | - | - | - |
| 2024-04-19 12:26 pm | - | - | - | 3.3 | 7 | 5.2 | S | - | - | - | 74.1 | - | - | - | - |
| 2024-04-19 11:56 am | - | - | - | 3.0 | 7 | 5.2 | S | - | - | - | 73.9 | - | - | - | - |
| 2024-04-19 11:26 am | - | - | - | 3.3 | 7 | 5.1 | S | - | - | - | 73.9 | - | - | - | - |
| 2024-04-19 10:56 am | - | - | - | 3.3 | 7 | 5.2 | S | - | - | - | 73.8 | - | - | - | - |
| 2024-04-19 10:26 am | - | - | - | 3.3 | 7 | 5.0 | S | - | - | - | 73.6 | - | - | - | - |
| 2024-04-19 09:56 am | - | - | - | 3.3 | 6 | 5.1 | S | - | - | - | 73.6 | - | - | - | - |
| 2024-04-19 09:26 am | - | - | - | 3.0 | 6 | 4.9 | S | - | - | - | 73.4 | - | - | - | - |
| 2024-04-19 08:56 am | - | - | - | 3.0 | 6 | 5.0 | S | - | - | - | 73.4 | - | - | - | - |
| 2024-04-19 08:26 am | - | - | - | 3.0 | 6 | 4.9 | S | - | - | - | 73.2 | - | - | - | - |
| 2024-04-19 07:56 am | - | - | - | 3.3 | 6 | 4.9 | S | - | - | - | 73.2 | - | - | - | - |
| 2024-04-19 07:26 am | - | - | - | 3.3 | 6 | 4.8 | S | - | - | - | 73.2 | - | - | - | - |
| 2024-04-19 06:56 am | - | - | - | 3.0 | 6 | 4.7 | S | - | - | - | 73.2 | - | - | - | - |
| 2024-04-19 06:26 am | - | - | - | 3.3 | 6 | 4.6 | S | - | - | - | 73.2 | - | - | - | - |
| 2024-04-19 05:56 am | - | - | - | 3.3 | 6 | 4.6 | S | - | - | - | 73.2 | - | - | - | - |
| 2024-04-19 05:26 am | - | - | - | 3.3 | 6 | 4.7 | S | - | - | - | 73.2 | - | - | - | - |
| 2024-04-19 04:56 am | - | - | - | 3.0 | 5 | 4.7 | S | - | - | - | 73.2 | - | - | - | - |
|
These wave data are displayed in rounded times. Click on the graph icon in the table below to see a time series plot of the last five days of that observation. | |
| 2.3 ft | |
| 0.0 ft | |
| 25.0 sec | |
| SSE | |
| 2.3 ft | |
| 5.6 sec | |
| S | |
| 4.6 sec | |
| TIME (CDT) |
WVHT ft |
SwH ft |
SwP sec |
SwD |
WWH ft |
WWP sec |
WWD |
STEEPNESS |
APD sec |
|---|---|---|---|---|---|---|---|---|---|
| 2024-04-20 04:56 am | 2.3 | 0.0 | 22.2 | SSW | 2.3 | 5.6 | S | N/A | 4.7 |
| 2024-04-20 03:56 am | 2.3 | 0.0 | 10.5 | SSE | 2.3 | 5.3 | S | N/A | 4.7 |
| 2024-04-20 03:26 am | 2.3 | 0.0 | 10.5 | SE | 2.3 | 5.6 | S | N/A | 4.7 |
| 2024-04-20 02:56 am | 2.3 | 0.0 | 13.3 | ESE | 2.3 | 5.9 | S | N/A | 4.8 |
| 2024-04-20 02:26 am | 2.3 | 0.0 | 10.5 | S | 2.3 | 5.9 | S | N/A | 4.7 |
| 2024-04-20 01:56 am | 2.3 | 0.0 | 10.5 | S | 2.3 | 5.6 | S | N/A | 4.8 |
| 2024-04-20 01:26 am | 2.3 | 0.0 | 10.5 | SSE | 2.3 | 5.9 | S | N/A | 4.8 |
| 2024-04-20 12:56 am | 2.3 | 0.0 | 10.5 | S | 2.3 | 5.6 | S | N/A | 4.9 |
| 2024-04-20 12:26 am | 2.6 | 0.0 | 10.5 | SSE | 2.6 | 5.9 | S | N/A | 4.9 |
| 2024-04-19 11:56 pm | 2.6 | 0.0 | 10.5 | SSE | 2.6 | 5.9 | S | N/A | 4.9 |
| 2024-04-19 11:26 pm | 2.6 | 0.0 | 25.0 | W | 2.6 | 6.2 | S | N/A | 4.9 |
| 2024-04-19 10:56 pm | 2.6 | 0.0 | 25.0 | SE | 2.6 | 6.2 | S | AVERAGE | 5.0 |
| 2024-04-19 10:26 pm | 2.6 | 0.0 | 22.2 | SSW | 2.6 | 6.2 | S | AVERAGE | 4.9 |
| 2024-04-19 09:56 pm | 2.6 | 0.0 | 10.5 | W | 2.6 | 6.2 | S | AVERAGE | 4.9 |
| 2024-04-19 09:26 pm | 2.6 | 0.0 | 10.5 | SSE | 2.6 | 6.2 | S | N/A | 4.8 |
| 2024-04-19 08:56 pm | 2.6 | 0.0 | 20.0 | ESE | 2.6 | 5.9 | S | STEEP | 4.9 |
| 2024-04-19 08:26 pm | 2.6 | 0.0 | 25.0 | SSE | 2.6 | 7.1 | SSE | N/A | 5.0 |
| 2024-04-19 07:56 pm | 2.3 | 0.0 | 10.5 | S | 2.3 | 6.2 | SSE | N/A | 4.8 |
| 2024-04-19 07:26 pm | 2.6 | 0.0 | 10.5 | W | 2.6 | 7.1 | S | AVERAGE | 5.0 |
| 2024-04-19 06:56 pm | 2.6 | 0.0 | 10.5 | S | 2.6 | 6.2 | S | AVERAGE | 5.1 |
| 2024-04-19 06:26 pm | 2.6 | 0.0 | 11.1 | S | 2.6 | 6.7 | S | N/A | 5.0 |
| 2024-04-19 05:56 pm | 2.6 | 0.0 | 10.5 | WSW | 2.6 | 5.9 | S | STEEP | 5.1 |
| 2024-04-19 05:26 pm | 2.6 | 0.0 | 10.5 | S | 2.6 | 6.7 | S | AVERAGE | 5.2 |
| 2024-04-19 04:56 pm | 2.6 | 0.0 | 10.5 | SSW | 2.6 | 6.7 | S | AVERAGE | 5.1 |
| 2024-04-19 04:26 pm | 2.6 | 0.0 | 10.5 | S | 2.6 | 5.9 | S | STEEP | 5.1 |
| 2024-04-19 03:56 pm | 2.6 | 0.0 | 10.5 | SSE | 2.6 | 6.7 | S | N/A | 5.1 |
| 2024-04-19 03:26 pm | 2.6 | 0.0 | 22.2 | S | 2.6 | 7.1 | S | AVERAGE | 5.2 |
| 2024-04-19 02:56 pm | 3.0 | 0.0 | 10.5 | SSE | 3.0 | 6.7 | S | AVERAGE | 5.1 |
| 2024-04-19 02:26 pm | 2.6 | 0.0 | 10.5 | S | 2.6 | 6.7 | S | AVERAGE | 5.0 |
| 2024-04-19 01:56 pm | 3.0 | 0.0 | 10.5 | SSE | 3.0 | 6.2 | S | STEEP | 5.1 |
| 2024-04-19 01:26 pm | 3.0 | 0.0 | 10.5 | S | 3.0 | 6.7 | S | AVERAGE | 5.2 |
| 2024-04-19 12:56 pm | 3.0 | 0.0 | 11.1 | SW | 3.0 | 5.9 | S | STEEP | 5.2 |
| 2024-04-19 12:26 pm | 3.3 | 0.0 | 10.5 | SSE | 3.3 | 6.7 | S | AVERAGE | 5.2 |
| 2024-04-19 11:56 am | 3.0 | 0.0 | 10.5 | SSE | 3.0 | 6.7 | S | AVERAGE | 5.2 |
| 2024-04-19 11:26 am | 3.0 | 0.0 | 10.5 | S | 3.0 | 6.7 | S | AVERAGE | 5.1 |
| 2024-04-19 10:56 am | 3.3 | 0.0 | 10.5 | S | 3.3 | 6.7 | S | AVERAGE | 5.2 |
| 2024-04-19 10:26 am | 3.0 | 0.0 | 10.5 | S | 3.0 | 6.7 | S | AVERAGE | 5.0 |
| 2024-04-19 09:56 am | 3.3 | 0.0 | 10.5 | S | 3.3 | 5.9 | S | STEEP | 5.1 |
| 2024-04-19 09:26 am | 3.0 | 0.0 | 10.5 | SSE | 3.0 | 6.2 | S | STEEP | 4.9 |
| 2024-04-19 08:56 am | 3.0 | 0.0 | 10.5 | SSE | 3.0 | 5.9 | S | STEEP | 5.0 |
| 2024-04-19 08:26 am | 3.0 | 0.0 | 10.5 | SE | 3.0 | 6.2 | S | STEEP | 4.9 |
| 2024-04-19 07:56 am | 3.3 | 0.0 | 10.5 | SSW | 3.3 | 5.9 | S | STEEP | 4.9 |
| 2024-04-19 07:26 am | 3.3 | 0.0 | 10.5 | SSE | 3.3 | 5.9 | S | STEEP | 4.8 |
| 2024-04-19 06:56 am | 3.0 | 0.0 | 10.5 | S | 3.0 | 5.9 | S | STEEP | 4.7 |
| 2024-04-19 06:26 am | 3.0 | 0.0 | 10.5 | SSE | 3.0 | 5.6 | S | STEEP | 4.6 |
| 2024-04-19 05:56 am | 3.0 | 0.0 | 22.2 | WSW | 3.0 | 6.2 | S | STEEP | 4.6 |
| 2024-04-19 05:26 am | 3.0 | 0.0 | 10.5 | S | 3.0 | 5.9 | S | STEEP | 4.7 |
| 2024-04-19 04:56 am | 3.0 | 0.0 | 10.5 | SSE | 3.0 | 5.3 | S | STEEP | 4.7 |
Links which are specific to this station are listed below:
Real Time Data in tabular form for the last forty-five days.
Historical Data & Climatic Summaries for quality controlled data for prior months and years.