


What happens to wave height during a hurricane?
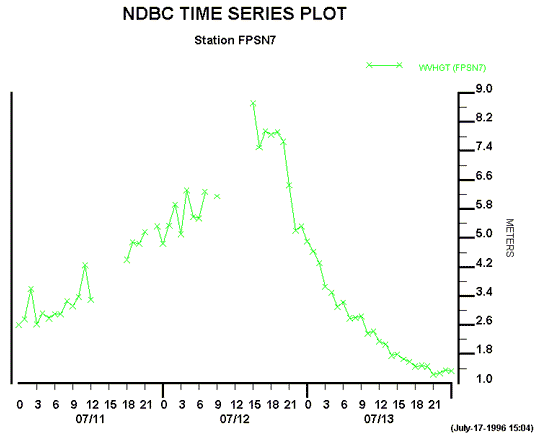
This figure shows a plot of the significant wave height measured at Station FPSN7 -- Frying Pan Shoals, North Carolina during Hurricane Bertha in July 1996. Significant wave height is defined as the average of the highest one-third of the waves. So, this plot shows the average of the highest one-third of the wave heights for each hour. As you can see, this hurricane caused significant wave heights of 9 meters (30 feet)!! Before the passage of the hurricane, significant wave height was only 1.0 meter (about 3 feet). This is not shown on the figure. As the storm came closer to FPSN7, the significant wave height began to increase. On July 12 at hour 0, the wave height increased to almost 5 meters (16.5 feet). At the pinnacle of the storm, the height increased dramatically to 9 meters. After the storm passed, wave height decreased to a level of 1.4 meters (4.5 feet). You can also see from the figure that periods of missing data occur. This is quite logical given the violent conditions caused by the hurricane.
Return to Science Education Home