


What are tides?
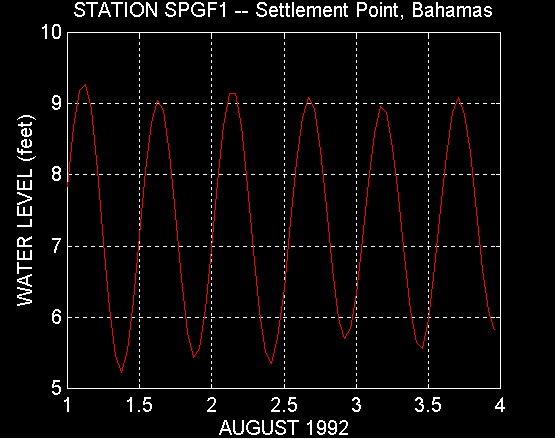
This plot shows water level data for the first three days of August 1992 from a NDBC station in the Bahamas. As you can see from the plot, there are two high tides and two low tides each day. Notice, however, that the two high tides each day are not the same height. Also notice that the two high tides also differ on a day-to-day basis. The same can be said of the low tides.
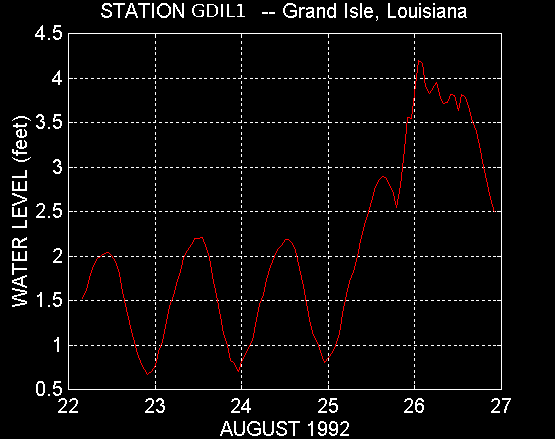
The next image shows water level data from Station GDIL1 (Grand Isle, LA) from August 22, 1992 through August 26, 1992. Notice that you do not see the twice daily occurrences of both high and low tides. This is because the Gulf of Mexico isn't an "open" body of water. It is "semi-enclosed". Therefore, the inflow and outflow of water, which causes the phenomena called tides, is blocked by the land surface of Mexico. Therefore, only one high and low tide occurs each day. Notice, however, the high water levels on August 25 and August 26. This is due to the storm surge caused by the strong winds of Hurricane Andrew. A hurricane's winds "pushes" the water ahead of the storm and creates a "large wall" of water called storm surge. Eventually, the storm surge reaches land and causes large amounts of property damage.
You may ask "What does a hurricane have to do with tides?" Well you are correct; they are two separate events. Remember, we are not measuring only tides, we are measuring water level. Water level is influenced by events such as earthquakes and hurricanes.
Return to Science Education Home